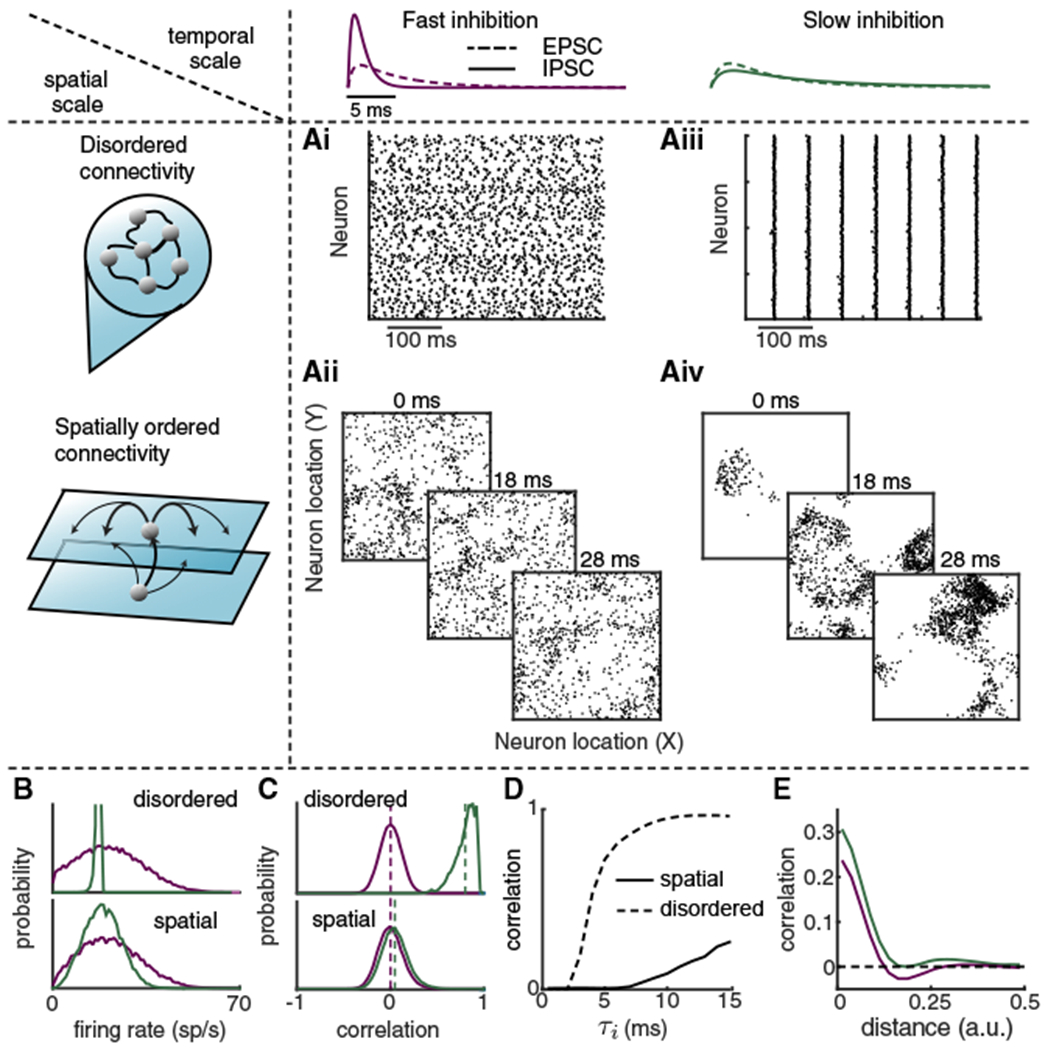
Figure 3. The Spatial and Temporal Scales of Synaptic Coupling Determine Internally Generated Variability.

(A) Networks of excitatory and inhibitory neuron models were simulated with either disordered connectivity (Ai and Aiii) or spatially ordered connectivity (Aii and Aiv), and with either fast inhibition (τi = 1 ms; Ai and Aii) or slow inhibition (τi = 8 ms; Aiii and Aiv). The integral of inhibitory postsynaptic current overtime is conserved as we change τi. In all models the timescale of excitation was τe = 5 ms. In the disordered networks, spike train rasters assume no particular neuron ordering. In the spatially ordered networks, three consecutive spike raster snapshots are shown with a dot indicating that the neuron at spatial position (x, y) fired within 1 ms of the time stamp.
(B) Distributions of firing rates of excitatory neurons in the disordered (top) and spatially ordered (bottom) models, with faster inhibitory kinetics (purple) compared to slower inhibitory kinetics (green).
(C) Same as (B) for the distributions of pairwise correlations among the excitatory population.
(D) Mean correlation among the excitatory population as a function of the inhibitory decay time constant (τi).
(E) Pairwise correlation as a function of distance between neuron pairs for spatially ordered models with slower inhibitory kinetics (green) compared to faster inhibitory kinetics (purple).
