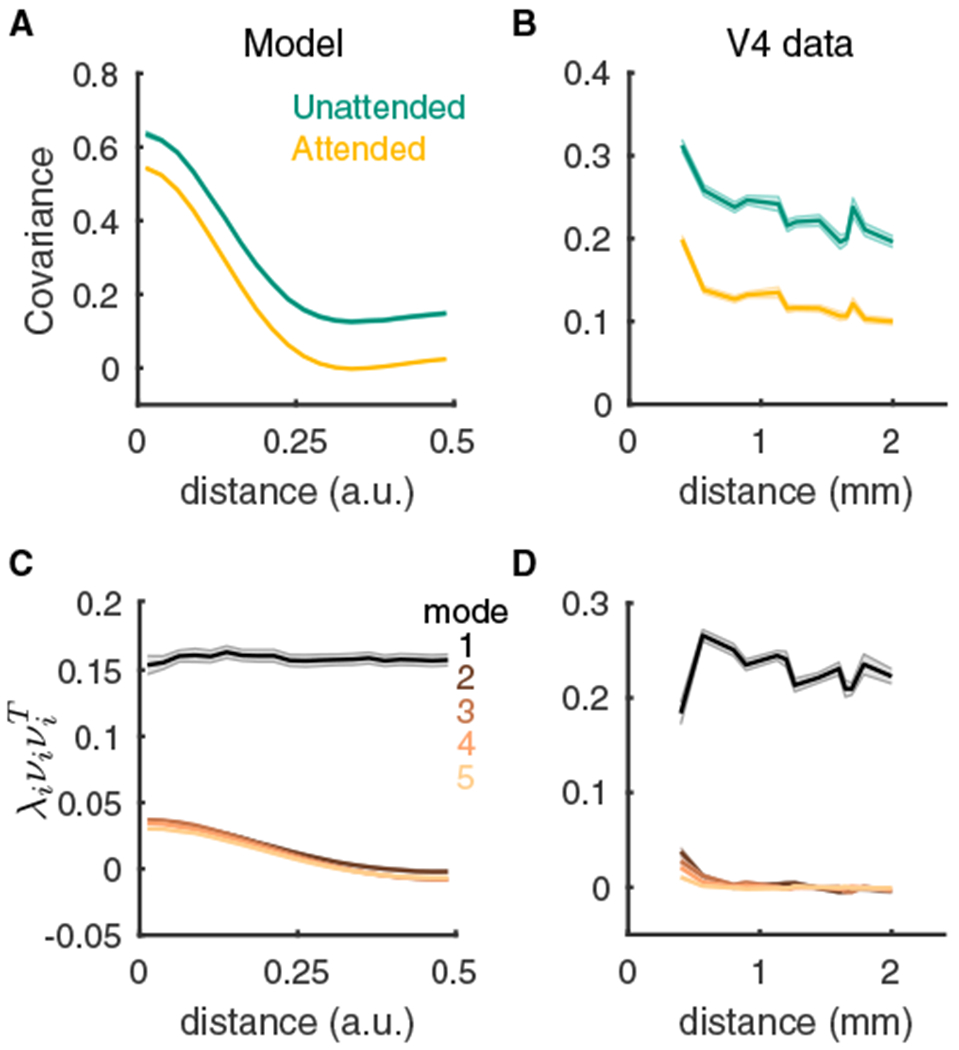
Figure 6. Distance Dependence of Pairwise and Population-wide Variability.

(A) Pairwise covariance of spike counts from our spiking model as a function of the distance between the neurons.
(B) Same as (A) but for the V4 data. Here the distance is between the electrodes that recorded the neuron pair.
(C) The distance dependence functions of the first five covariance components computed from factor analysis of the model spiking activity in the unattended state. For mode i the product of the eigenmode loading onto a pair of neurons is plotted as a function of the distance between the neurons. To properly compare the modes, we scaled each curve by the eigenvalue λi for that mode.
(D) Same as (C) but for the V4 data in the unattended state. Shaded regions are SEM. See Table S2 for the number of pairs at each distance value for the V4 data; for the model we used n = 80 sessions of 500 neurons each.
