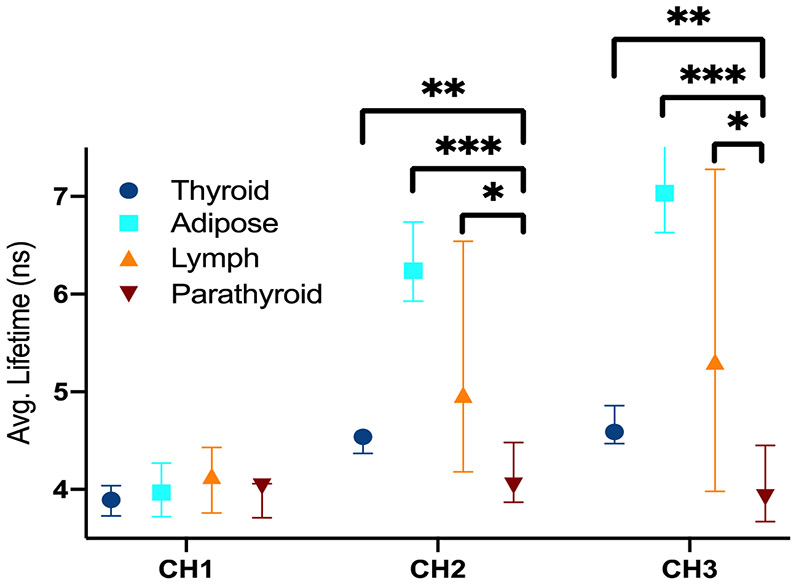
Figure 3: Average fluorescence lifetime for various tissues imaged in vivo for N=15 patients.
The lifetimes are displayed for all three spectral channels. A patient level median lifetime was calculated for each tissue type for each patient. The Mann-Whitney U test was performed to check for statistically significant differences between tissue types. * p<0.05 ** p<0.01 *** p<0.001.

