
Fig. 5.
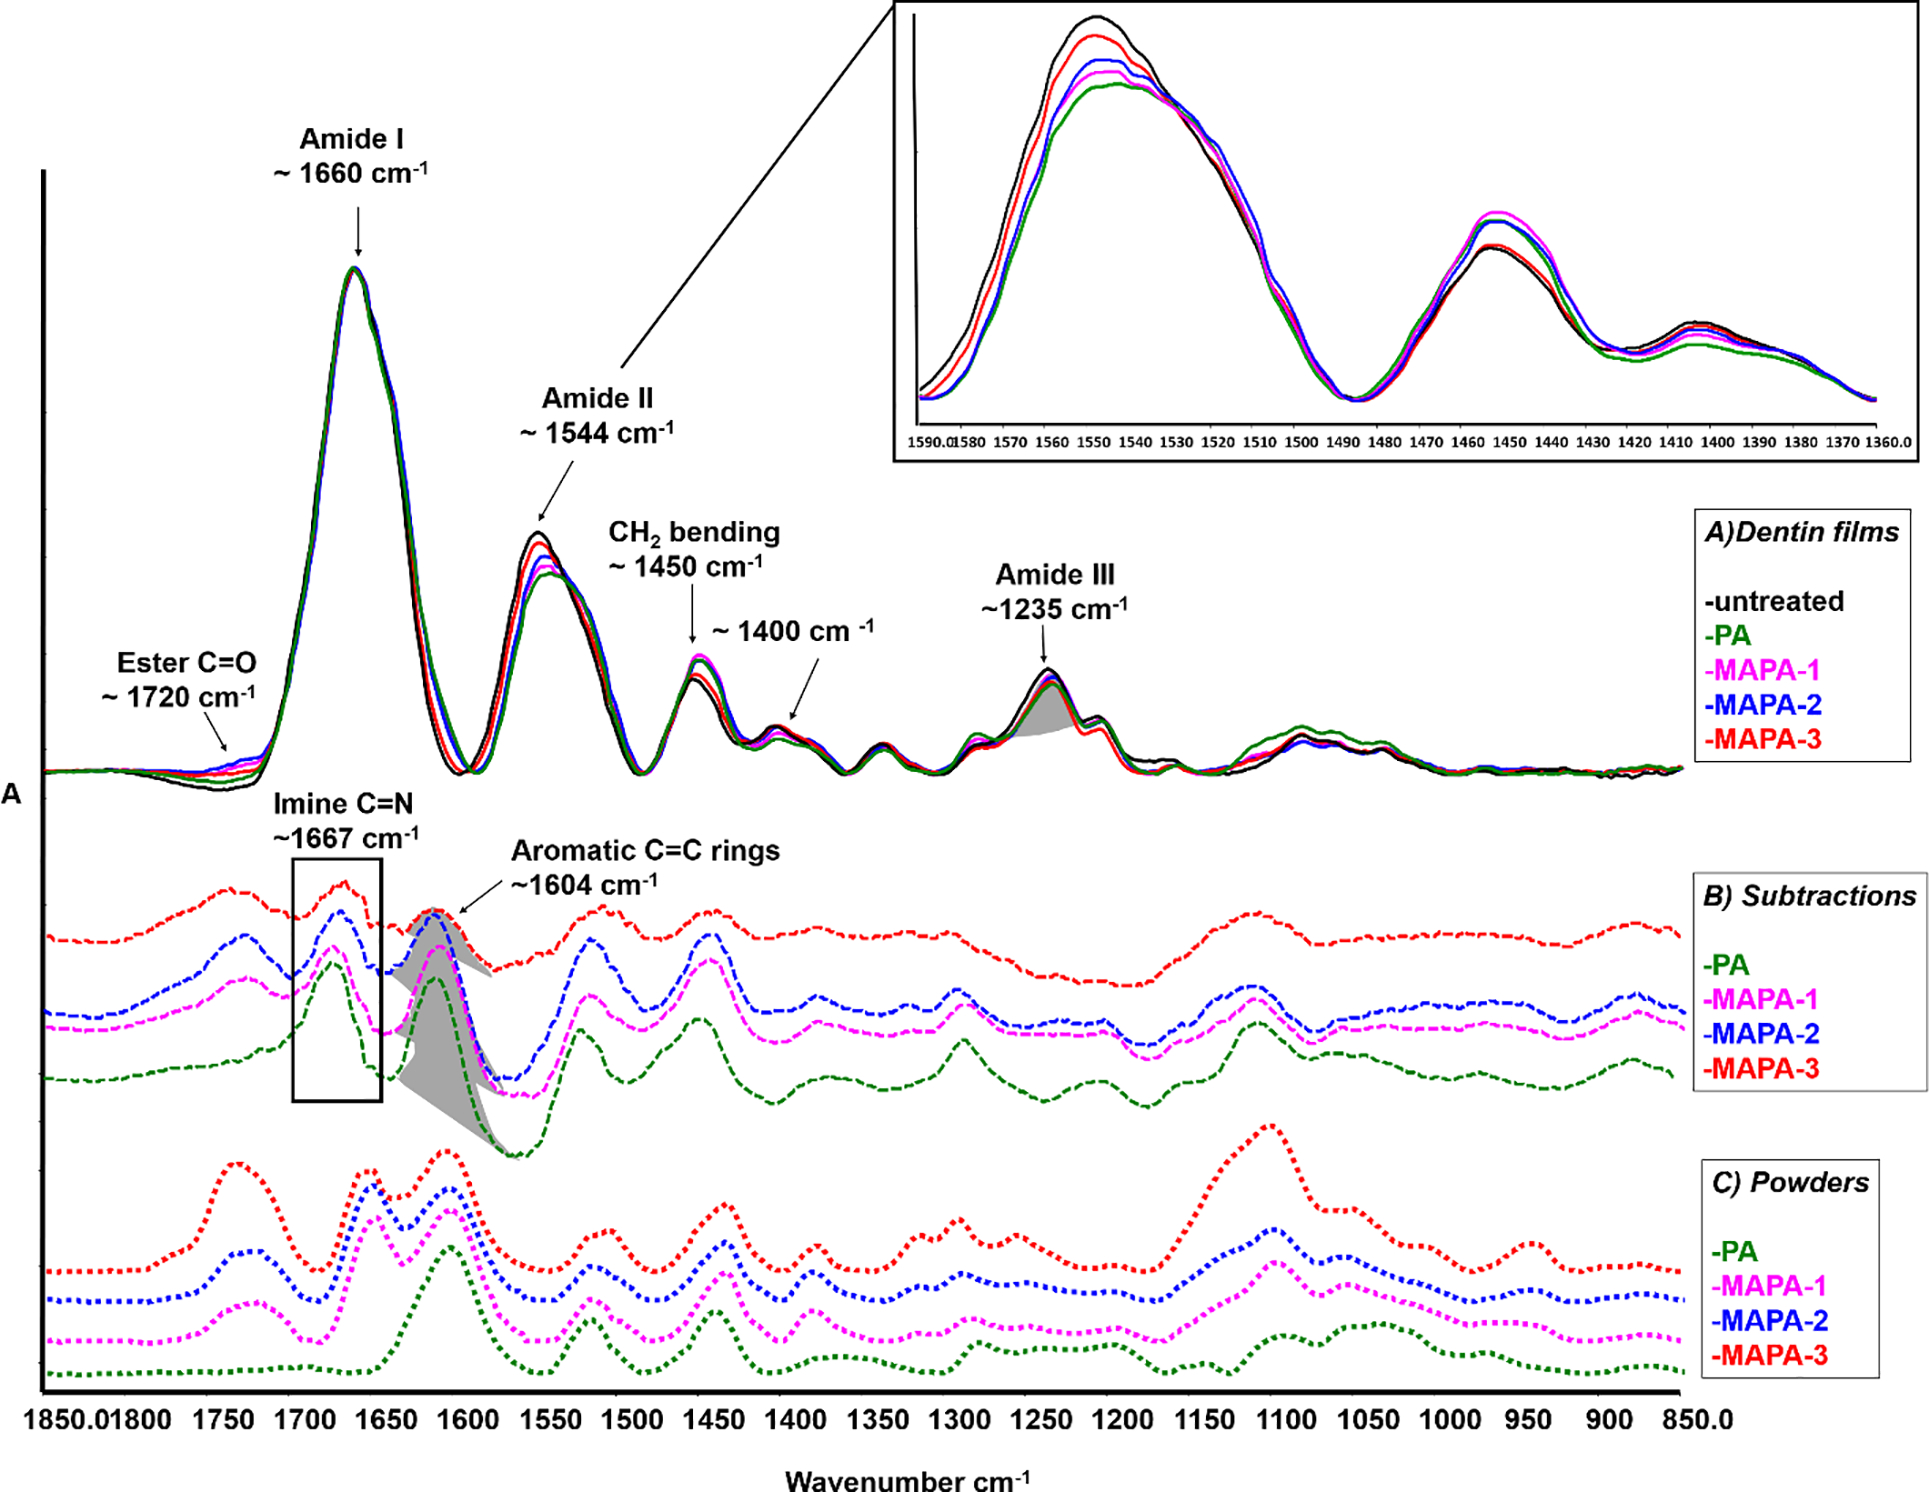
A) FITR spectra of untreated and treated dentin collagen films, in which main band assignments and associated spectral changes are identified after PA and MAPAs treatments (top spectra, solid lines), a closer peek at the spectra ranging from 1590–1360 cm−1 is in the top right corner. B) Difference FTIR spectra of treated dentin films with the spectrum of untreated collagen subtracted (middle spectra, dashed lines). C) FTIR spectra of PA and MAPAs powders (bottom spectra, dotted lines). The highlighted band area ratios at ~1604 cm−1 of C=C aromatic rings (resulting difference spectra) and at ~1235 cm−1 of amide III (untreated collagen) were calculated and shown in Table 1.