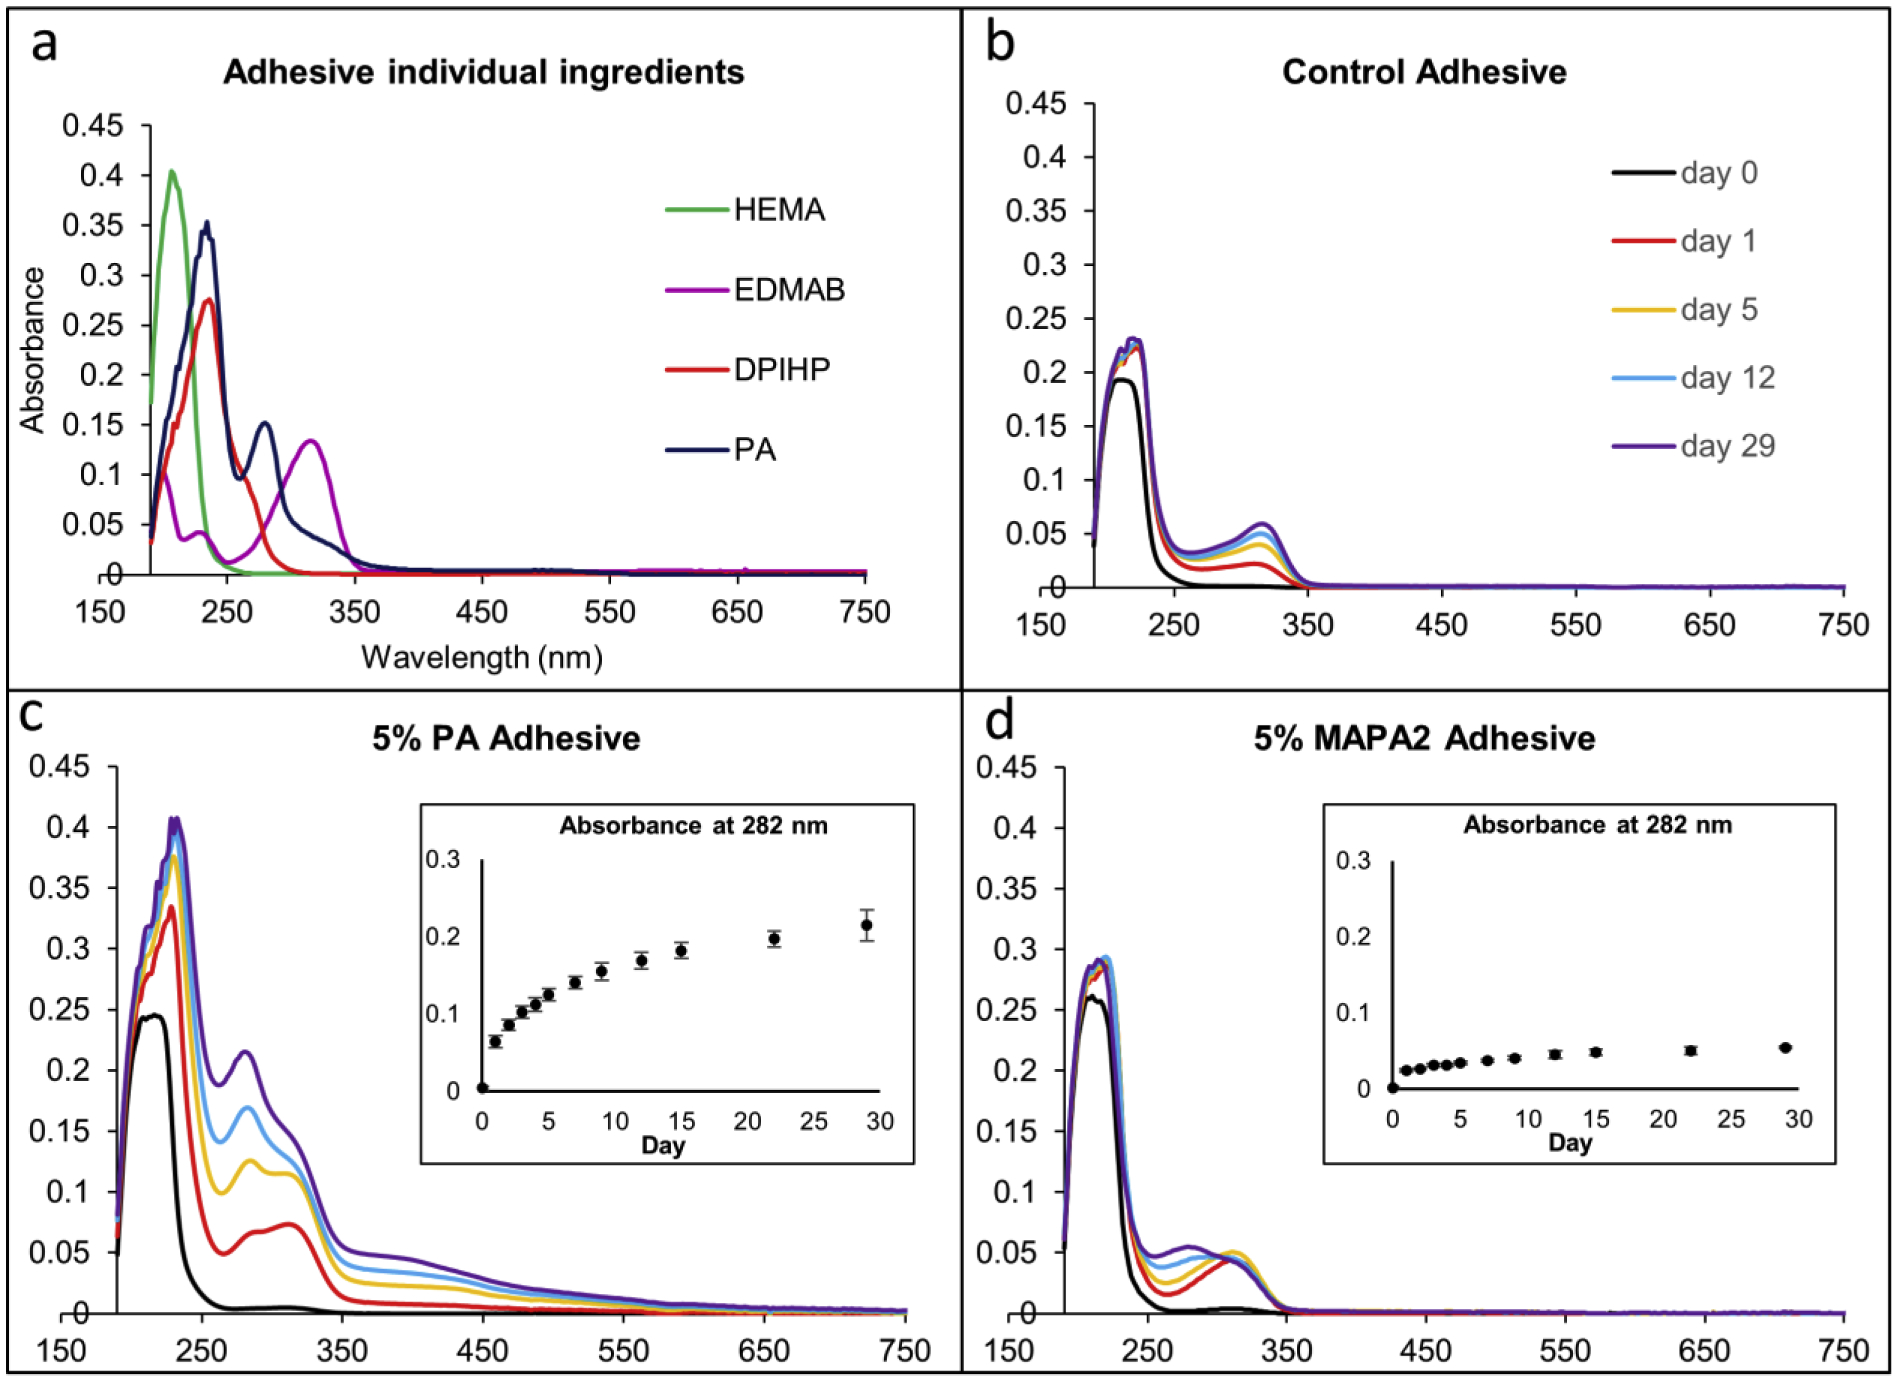
Fig. 5.

UV-Vis absorbance results of (a) HEMA, EDMAB, DPIHP, and PA solutes in water (b) cured control adhesive (c) cured 5% PA adhesive, and (d) cured 5% MAPA-2 adhesive. The absorption curves in (b), (c), and (d) are normalized to 1 mg adhesive in 3 mL of water. Representative absorbance curves are plotted for (b), (c), and (d) to avoid figure crowdedness. Complete absorbance data at 282 nm from day 0 to day 29 (average and standard deviation) are included in the inserts of (c) and (d).
