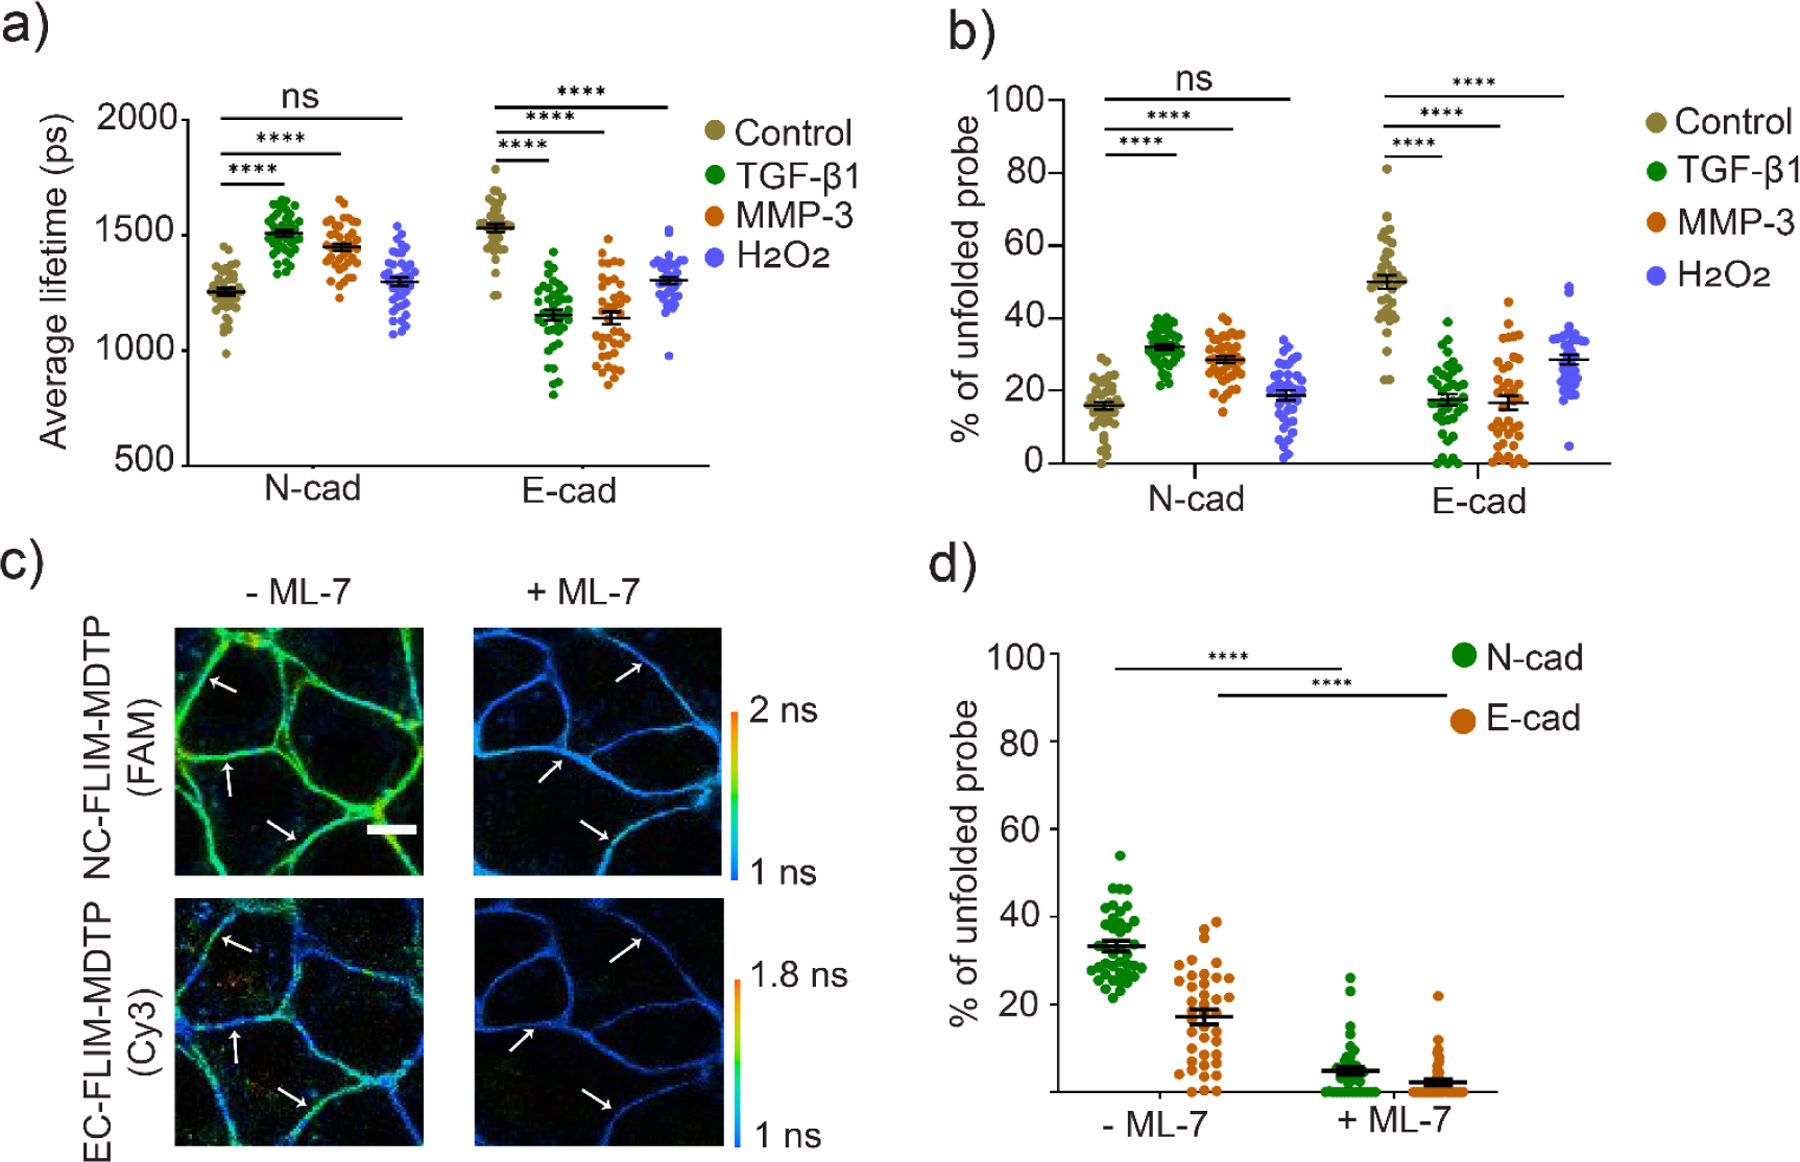
Figure 4.

Multiplexed imaging of E-cadherin- and N-cadherin-mediated tension after the EMT induction. (a) MCF7 cells were first treated with 1% DMSO (control), 30 ng/mL of TGF-β1, 2 µM MMP-3, or 50 µM H2O2 for 48–72 h. Distributions of cell–cell junction fluorescence lifetime after adding different types of EMT inducers. (b) Percentages of the unfolded NC-FLIM-MDTP (FAM) and EC-FLIM-MDTP (Cy3) at each cell–cell junction after the treatment with each EMT inducer. (c) MCF7 cells were first treated with 30 ng/mL of TGF-β1 for 72 h to induce EMT. A mixture of 200 nM NC-FLIM-MDTP (FAM) and EC-FLIM-MDTP (Cy3) was then added and incubated for 30 min before imaging. Representative images are shown in the presence or absence of 2 mM ML-7. Scale bar, 10 µm. (d) Percentages of the unfolded NC-FLIM-MDTP (N-cad) and EC-FLIM-MDTP (E-cad) at each cell–cell junction in the presence or absence of 2 mM ML-7. Shown are mean and standard error of the mean (SEM) values from at least 40 cell–cell junctions in each case. ****p< 0.0001 in two-tailed Student’s t-test; ns, not significant.
