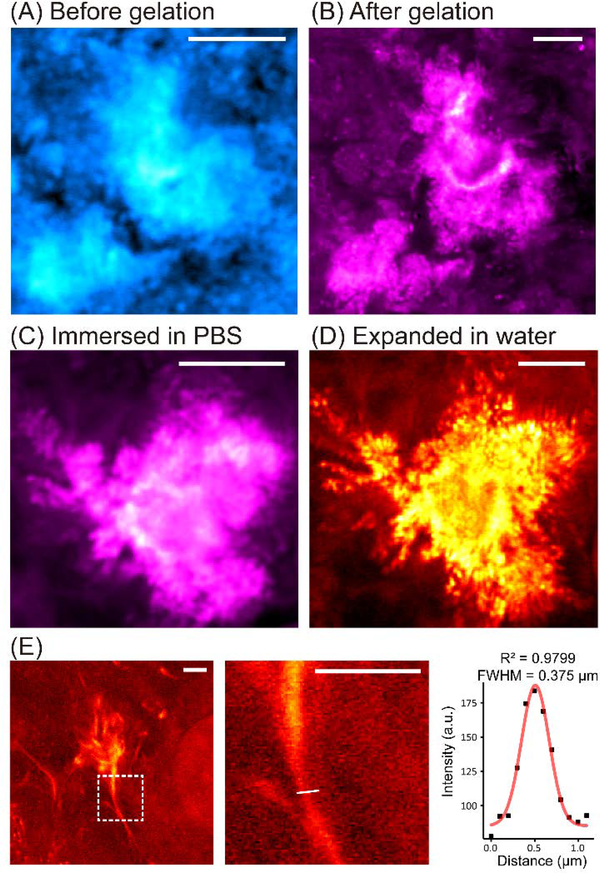
Fig. 3. Characterization of Aβ plaque expansion.
(A-B) SRS images (at 2940 cm−1) for the same plaques before (A) and after (B) gelation. No obvious changes of location and morphology are observed. (C-D) SRS images (at 2940 cm−1) for the same plaques after gelation and immersed in PBS (C) versus in water (D). No distortion is shown during expansion in water with much-enhanced resolution. (E) The intensity profile of a fibril structure (boxed, the zoomed-in view shown on the right, the white line indicates the cross section for intensity fitting) in the expanded Aβ plaques imaged by VISTA is fitted by a gaussian distribution with a FWHM of 375 nm. Scale bars: 10 μm in (A)-(D), 5 μm in (E).

