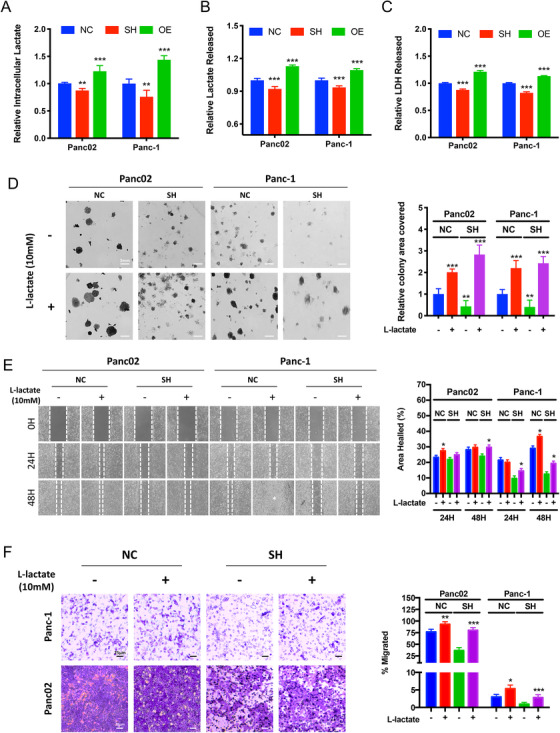
FIGURE 3.

Promoting LDHA enzymatic activity enhances proliferation, migration and invasion ability of LDHA knockdown cells. (A) Intracellular lactate assay was performed with cells with exogenous LDHA expression. The graph represents the relative intensity of lactate detected intracellularly in LDHA overexpressed (OE) and knockdown (SH) cells compared with that of the controlled (NC) cells (n = 6 per group, **P < 0.01, ***P < 0.001). (B) Extracellular lactate assay was performed with cells with exogenous LDHA expression. The graph represents the relative intensity of lactate detected in the culture supernatant of LDHA overexpressed (OE) and knockdown (SH) cells compared with that of the controlled (NC) cells normalized per cell numbers (n = 6 per group, ***P < 0.001). (C) In vitro LDH release assay was performed to assess LDH enzymatic activity among cells with differential LDHA expression. The graph represents the relative intensity of LDH released detected in the culture supernatant (n = 6 per group, ***P < 0.001). (D) Colony formation assay was performed with controlled cells (NC) and LDHA knockdown (SH) cells supplement with 10 mM L‐lactate. The graph represents the percentage of area covered by colonies after 10 days of incubation (n = 6 per group, **P < 0.01, ***P < 0.001). (E) Scratch wound healing assay was performed controlled (NC) cells and LDHA knockdown (SH) cells supplement with 10 mM L‐lactate. The graph represents the wound confluence percentage after 24 and 48 hours of incubation (n = 3 per group, *P < 0.05). (F) Boyden chamber invasion assay was performed for 24 hours with controlled (NC) cells and LDHA knockdown (SH) cells with or without 10 mM L‐lactate. The graph represents the percentage of area covered by migrated cells after incubation (n = 6 per group, *P < 0.05, **P < 0.01, ***P < 0.001). NC: controlled cells; SH: LDHA knockdown cells; OE: LDHA overexpressed cells
