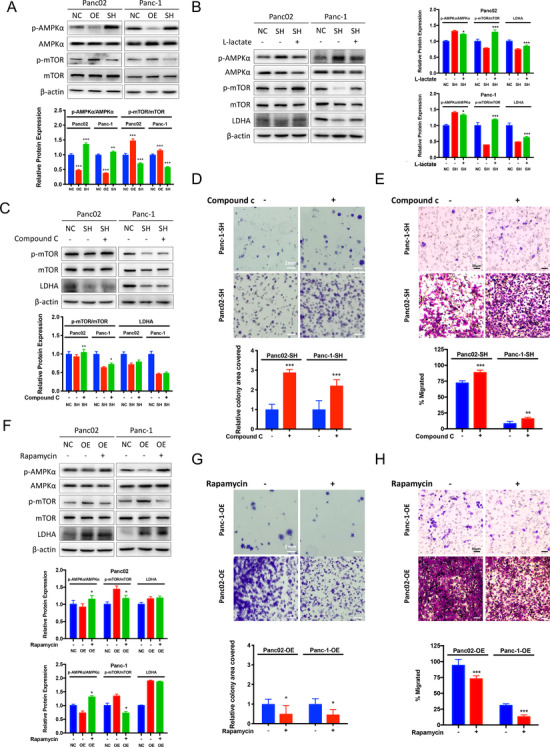
FIGURE 4.

L‐lactate restores AMPK activation by LDHA knockdown and LDHA is an upstream of the AMPK‐mTOR pathway. (A) The expression of the indicated proteins was analyzed by immunoblotting. The graph represents the relative protein expression ratio of pAMPKa/AMPKa and pmTOR/mTOR normalized to beta‐actin compared to the controlled (NC) cells (n = 3 per group, **P < 0.01, ***P < 0.001). (B) LDHA knockdown (SH) cells were incubated with 10 mM L‐lactate for 24 hours. The graph represents the relative protein expression ration of pAMPKa/AMPKa and pmTOR/mTOR normalized to beta‐actin compared to the nontreated knockdown (SH) cells (n = 3 per group, *P < 0.05, ***P < 0.001). (C) LDHA knockdown (SH) cells were incubated with 20 μM AMPK inhibitor (Compound C) for 24 hours. The graph represents the relative protein expression ration of pAMPKa/AMPKa and pmTOR/mTOR normalized to beta‐actin compared to the nontreated knockdown (SH) cells (n = 3 per group, *P < 0.05, **P < 0.01). (D) Colony formation assay was performed with nontreated LDHA knockdown (SH) cells and LDHA‐SH cells supplement with 20 μM Compound C. The graph represents the percentage of area covered by colonies after 10 days of incubation (n = 6 per group, ***P < 0.001). (E) Boyden chamber invasion assay was performed for 24 hours with LDHA knockdown (SH) cells with or without 20 μM Compound C. The graph represents the percentage of area covered by migrated cells after incubation (n = 6 per group, **P < 0.01, ***P < 0.001). (F) LDHA overexpressed cells were incubated with 10 nm Rapamycin for 24 hours. The graph represents the relative protein expression ratio of pAMPKa/AMPKa and pmTOR/mTOR normalized to beta‐actin compared to the nontreated overexpressed (OE) cells (n = 3 per group, *P < 0.05). (G) Colony formation assay was performed with LDHA overexpressed (OE) cells supplement with or without 10 nm Rapamycin. The graph represents the percentage of area covered by colonies after 10 days of incubation compared to the nontreated overexpressed (OE) cells (n = 6 per group, *P < 0.05). (H) Boyden chamber invasion assay was performed for 24 hours with LDHA overexpressed cells treated with or without 10 nm Rapamycin. The graph represents the percentage of area covered by migrated cells after incubation (n = 6 per group, ***P < 0.001). NC: controlled cells; SH: LDHA knockdown cells; OE: LDHA overexpressed cells
