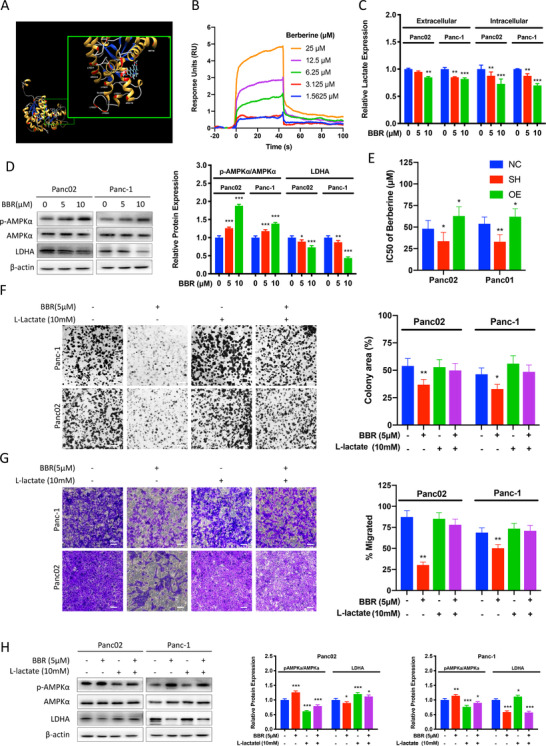
FIGURE 5.

Berberine suppressed pancreatic cancer proliferation and invasion by LDHA/AMPK pathway. (A) Berberine may direct bind to LDHA, as predicted by molecular docking. (B) Surface plasmon resonance (SPR) biosensor analysis of berberine binding to LDHA. The sonograms for binding of berberine in serial concentration (1.5625, 3.125, 6.25, 12.5, 25 μM) to LDHA are shown. (C) Intracellular and extracellular lactate assay were performed with cells incubated with 5 or 10 μM of berberine for 48 hours. The graph represents the relative intensity of lactate detected intracellularly and in the culture supernatant normalized per cell number compared to the respective controlled (NC) cells (n = 3 per group, *P < 0.05, **P < 0.01). (D) Control Panc02 and Panc‐1 cells were incubated with 5 or 10 μM of berberine (BBR) for 48 hours. The graph represents the relative protein expression ration of pAMPKa/AMPKa and LDHA normalized to beta‐actin compared to the nontreated control cells (n = 3 per group, *P < 0.05, **P < 0.01, ***P < 0.001). (E) MTT assay showed that berberine suppressed Panc02 and Panc‐1 pancreatic cancer cells proliferation and the cytotoxicities of berberine varies among different LDHA expression cells after 48 hours of incubation with berberine (n = 6 per group). (F) Colony formation assay was performed with controlled Panc02 and Panc‐1 cells treated with 5 μM berberine with or without supplementation with 10 mM L‐lactate. The graph represents the percentage of area covered by colonies after 10 days of incubation (n = 6 per group, **P < 0.01). (G) Boyden chamber invasion assay was performed for 24 hours with controlled Panc02 and Panc‐1cells treated with 5 μM berberine with or without supplementation with 10 mM L‐lactate. The graph represents the percentage of area covered by migrated cells after incubation (n = 6 per group, **P < 0.01). (H) Controlled Panc02 and Panc‐1 cells were incubated with or without 5 μM of berberine and supplanted with or without 10 mM L‐lactate for 24 hours. The graph represents the relative protein expression ration of pAMPKa/AMPKa and LDHA normalized to beta‐actin compared to the nontreated control cells (n = 3 per group, *P < 0.05, **P < 0.01, ***P < 0.001). BBR: berberine; IC50: half maximal inhibitory concentration; NC: controlled cells; SH: LDHA knockdown cells; OE: LDHA overexpressed cells
