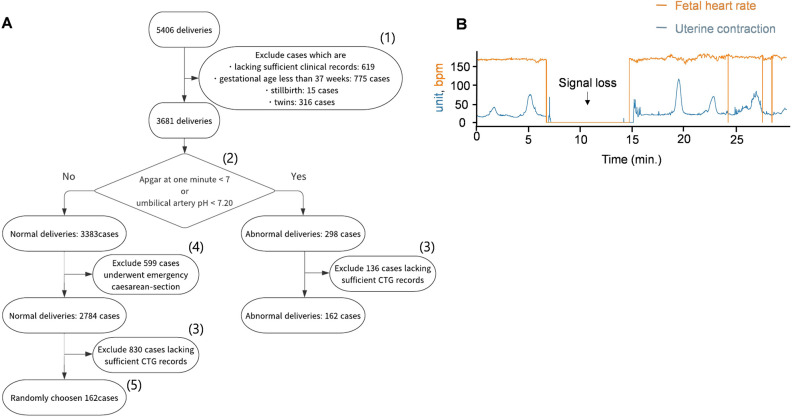
Figure 1.
(A) Flowchart of data sorting. (1) Twins, stillbirths and premature deliveries were excluded. (2) The remaining 3681 data were classified into the normal and abnormal groups by Apgar score at 1 min and umbilical artery pH. (3) Deliveries lacking sufficient CTG records were excluded for both groups. (4) Normal cases that underwent emergency cesarean section were excluded. (5) A total of 162 (same as the number of abnormal cases) normal cases were randomly subsampled. (B) Representative figure of signal loss in FHR and UC.

