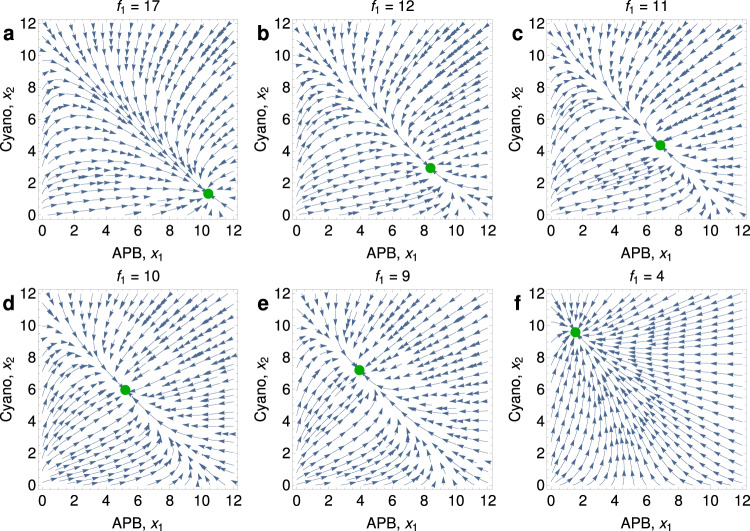
Fig. 4. Phase portraits of Eqs. (14) from Supplementary Note 1 illustrating a gradual transition are shown for six distinct values of f1, the influx rate of iron(II).
For values of f1 = 17 (a), 12 (b), 11 (c), 10 (d), 9 (e), and 4 (f), the stable equilibrium (green dot) moves continuously from a world that is dominated by APB to one that is dominated by cyanobacteria. Parameter values are f2 = 10, c = 1, a = 10, b = 12, u1 = u2 = 1, and α1 = α2 = 1. The GOE is gradual.

