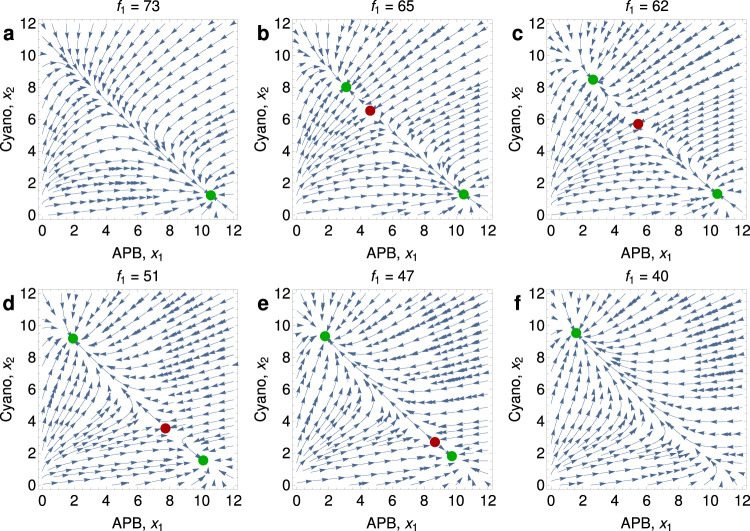
Fig. 6. Phase portraits of Eqs. (14) from Supplementary Note 1 illustrating a sudden transition are shown for six distinct values of f1, the influx rate of iron(II).
For f1 = 73 (a), there is a single stable equilibrium (green dot) describing a world dominated by APB. For values of f1 = 65 (b), 62 (c), 51 (d), and 47 (e), there is a second stable equilibrium (green dot) describing the dominance of cyanobacteria, and in addition, there is an unstable equilibrium (red dot). The unstable equilibrium moves as the value of f1 changes. For f1 = 40 (f), the only stable equilibrium is the one where cyanobacteria dominate. Parameter values are f2 = 10, c = 1, a = 10, b = 1, u1 = u2 = 1, and α1 = α2 = 1. The GOE is triggered by a saddle-node bifurcation and is sudden.

