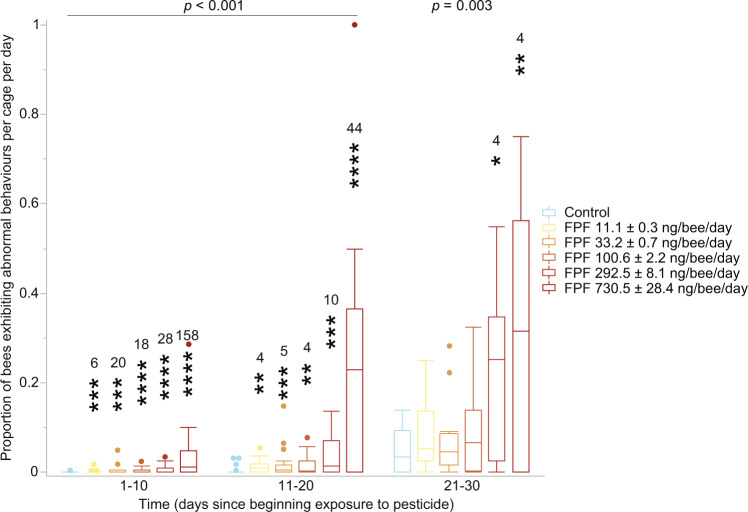
Fig. 3. Effects of flupyradifurone (FPF) on the daily proportion of living bees exhibiting at least one abnormal behaviour per cage.
We assessed the results in time blocks of 10 days to allow comparison between the standard 10-day risk assessment chronic test and longer term exposures36. We report the significance of the main effect of FPF treatment above each time period (Supplementary Table 10). Asterisks above the bars indicate significant differences between the respective FPF dose (reported in ng/bee/day, mean ± Standard Error of the Mean, SEM) and the controls (GLMDS; n = 111; *p = 0.05, **p = 0.01, ***p = 0.001, ****p = 0.0001; Supplementary Table 11). We report the effect sizes measured in fold-increase above each significant effect to facilitate interpretation given the low absolute values of the control treatment and the lower FPF doses (Supplementary Table 12). The box-plot reports the maximum (excluding outliers), the percentiles (75th, 50th, and 25th), the minimum (excluding outliers), and the outliers. Additional details are in Supplementary Tables 10, 12.

