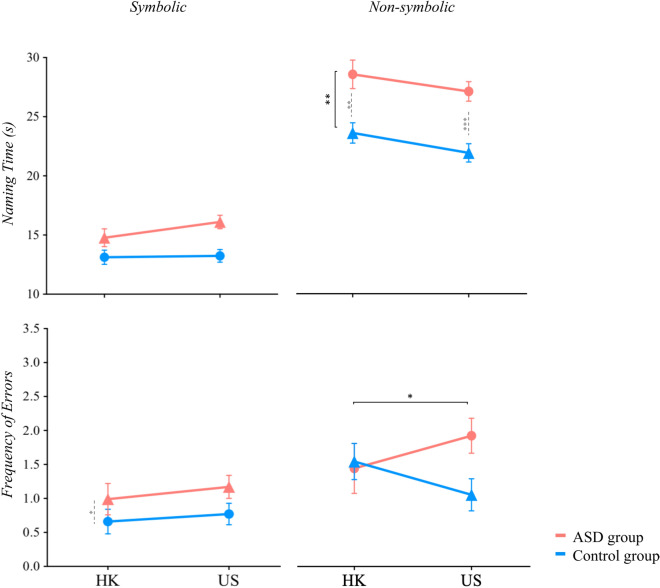
Figure 1.
RAN performance (naming time and error rates) across cultures, diagnostic groups, and conditions. A significant diagnosis effect emerged in the non-symbolic condition for naming time (Estimate = − 4.80 p < .01). Error bars represent standard error of the mean (SEM). For US-ASD versus US-control group comparisons, refer to Nayar et. al., 20188. *p < .05, **p < .01, ***p < .001. Black overall bars denote significance of the overall model (i.e., group effect, diagnosis effect), and dashed grey lines indicate pair-wise comparisons.

