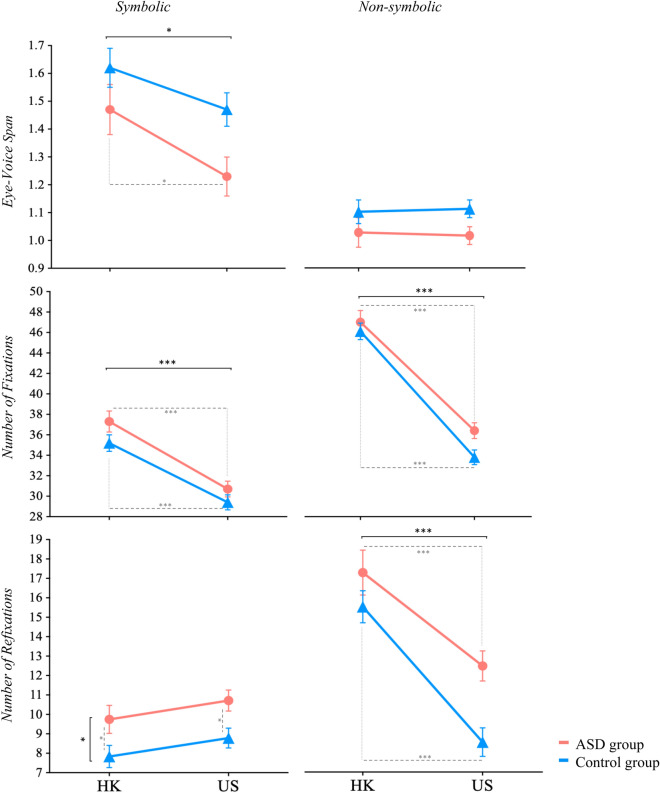
Figure 2.
RAN eye-movement variables across cultures, diagnostic groups, and conditions. Culture effect for EVS symbolic condition (Estimate = − 0.23, p < .05) and total fixations across conditions (Estimates < -6.52, ps < .0001). Diagnostic effect for refixations during symbolic condition (Estimate = −0.190, p < .05) and culture effect during non-symbolic condition (Estimate =− 4.77, p < .001). Error bars represent standard error of the mean (SEM). For US-ASD versus US-control group comparisons, refer to Nayar et. al., 20188. *p < .05, **p < .01, ***p < .001. Black overall bars denote significance of the overall model (i.e., group effect, diagnosis effect), and dashed grey lines indicate pair-wise comparisons.

