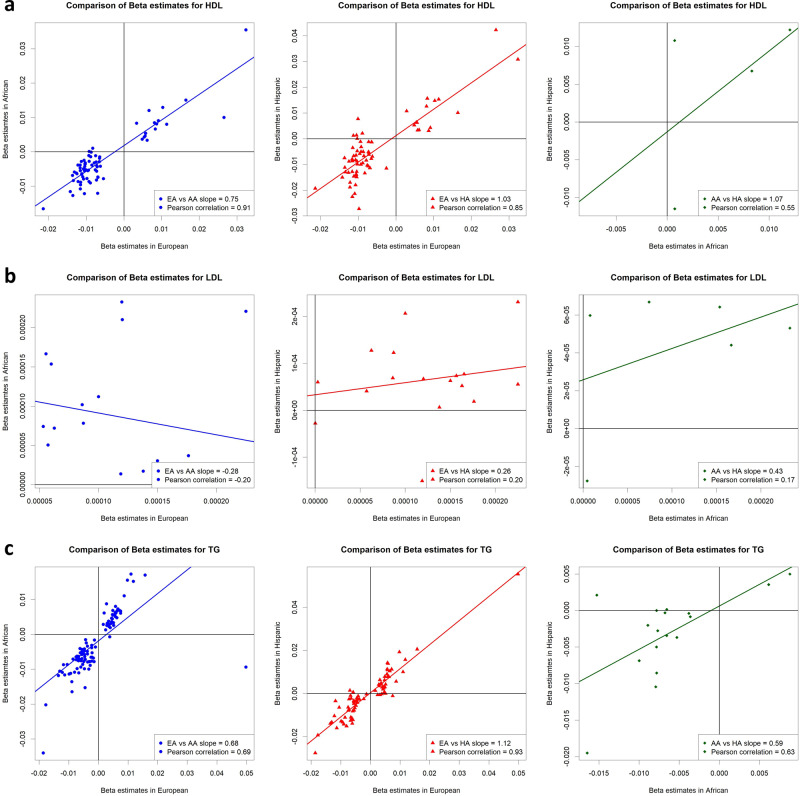
Fig. 2. Scatter plots and regression lines of beta estimate pairs observed in two racial/ethnic groups for CpG-lipid trait associations.
Plotted are betas from CpGs found to be significant (P < 1.09 × 10⁻⁷) in one or more racial/ethnic group. Plots and lines are shown between Europeans (EA) and African Americans (AA) (blue arrowheads/lines), Europeans (EA) and Hispanics (HA) (red triangles/lines), and African Americans (AA) and Hispanics (HA) (green diamonds/lines) for (a) high-density lipoprotein (HDL), (b) low-density lipoprotein (LDL), and (c) triglycerides (TG). Numerical regression slope and Pearson correlation coefficients are presented in the bottom right corner of each plot.

