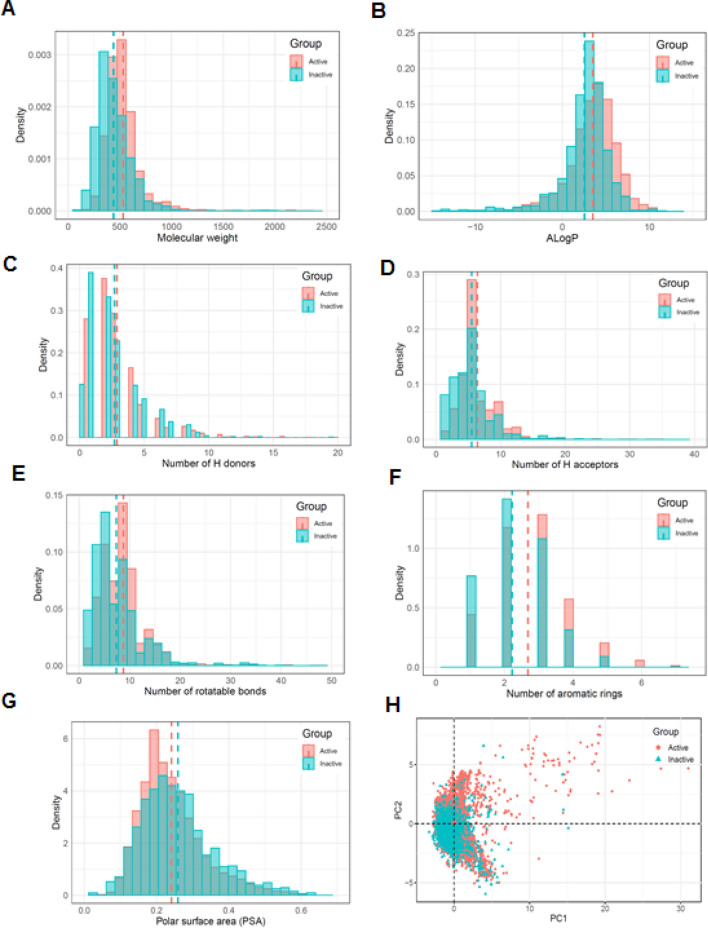
Figure 2.
Physicochemical profile of compounds from iPPI datasets. (A–G) Chemical properties of the compounds from the iPPI datasets are compared using the histogram for the seven molecular descriptors. The dotted lines represent mean values, and the histogram bars of the active and inactive group are colored red and light green, respectively, whereas the dark green bar represents the overlap region. (H) Distribution of the chemical space of the compounds in the iPPI datasets according to principal component analysis. All histograms and scatter plots were generated using the R software.

