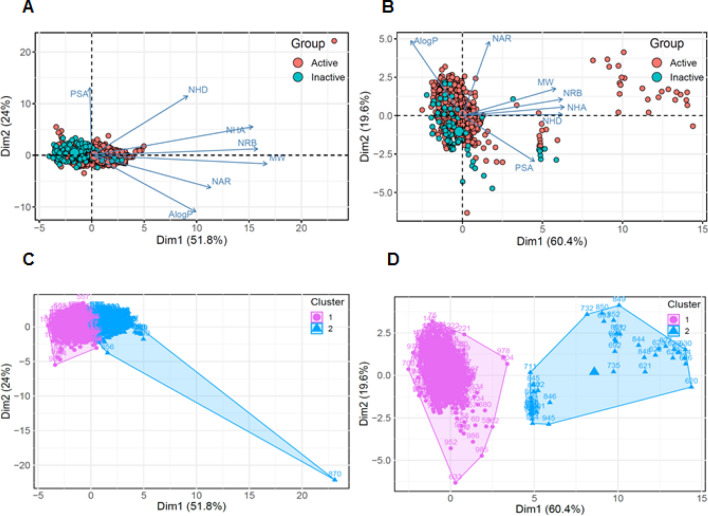
Figure 3.
Visual representation of the chemical space of Bcl-2 and MDM2 dataset. Principal component analysis (PCA)-based clustering representing the comparison of the chemical space on active/inactive datasets in the Bcl-2 and MDM2 datasets. (A,B) Distribution of the chemical space of the compounds in the Bcl-2 and MDM2 dataset according to principal component analysis. The loading plot vectors are represented by arrows for each physicochemical property. (C,D) Data points are color-coded by cluster of molecules. The magenta and blue dots correspond to active compounds in the clusters 1 and 2, respectively.

