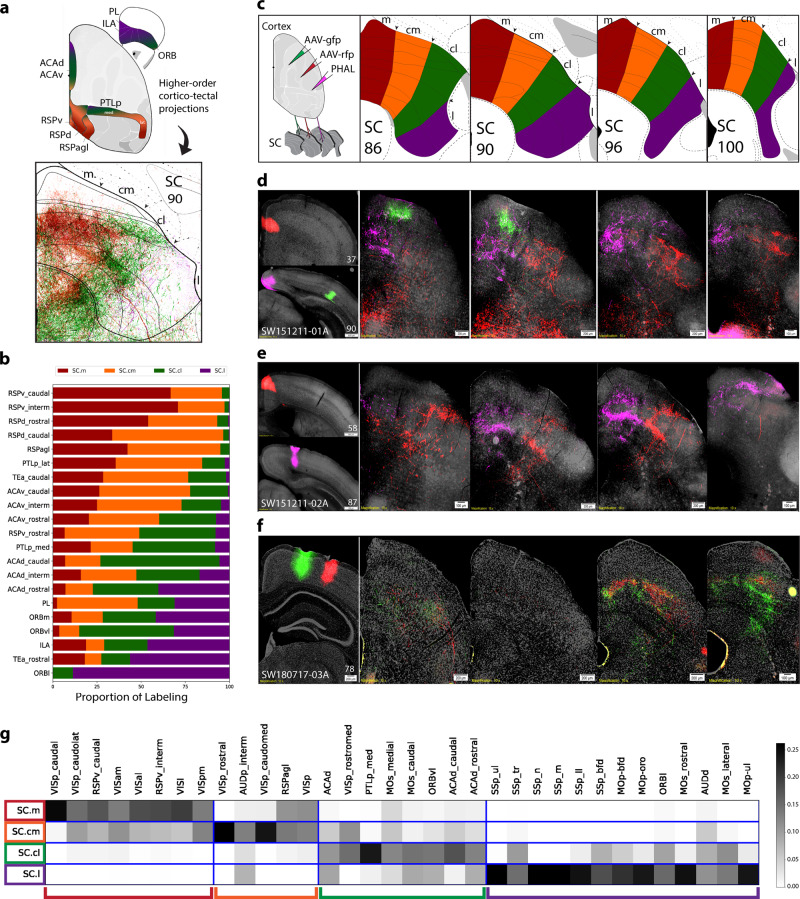
Fig. 3. Distribution of higher-order cortical inputs across SC zones.
a Schematic of higher-order association areas part of medial cortico-cortical subnetworks (Zingg et al., 2014). Color-coding is consistent with the SC zones, and represents the topography based on cortico-tectal projection patterns that target distinct zones. Reconstruction is composite of inputs to SC ARA 90. b Stacked bar chart for visualization of proportion of labeling across each SC zone (x-axis) from each cortical ROI (y-axis) for each selected ROI. Values represent proportion of pixel density for each individual ROI across each zone (n = 1 case per row). See Supplementary Table 4 for zone- and layer-specific values. c Schematic of anterograde injection strategy, and custom SC atlas levels. d Raw data panels. VISp, RSPv, and ACAd-rostral projections to SC. e ACAd-interm and VISam projections. f Two PTLp-medial projections projection to caudal SC levels. g Visualization of cortico-tectal modular communities within the SC (n = 34 cases). Matrices show communities identified by Louvain analysis of cortical injection ROIs (y-axis) and SC zones (x-axis). Edges are shaded according to their connectivity labeling, and boxes along the diagonal reflect modular communities identified. Legend on right side is based on the range of normalized values calculated by the Louvain algorithm. Value 0.25 represents the maximum intensity (black), and value 0 represents the minimum (white). Color-coded brackets below the matrix communities correspond to the same color codes in the SC custom atlas zones. Color-code associations: red (SC.m), orange (SC.cm), green (SC.cl), purple (SC.l).

