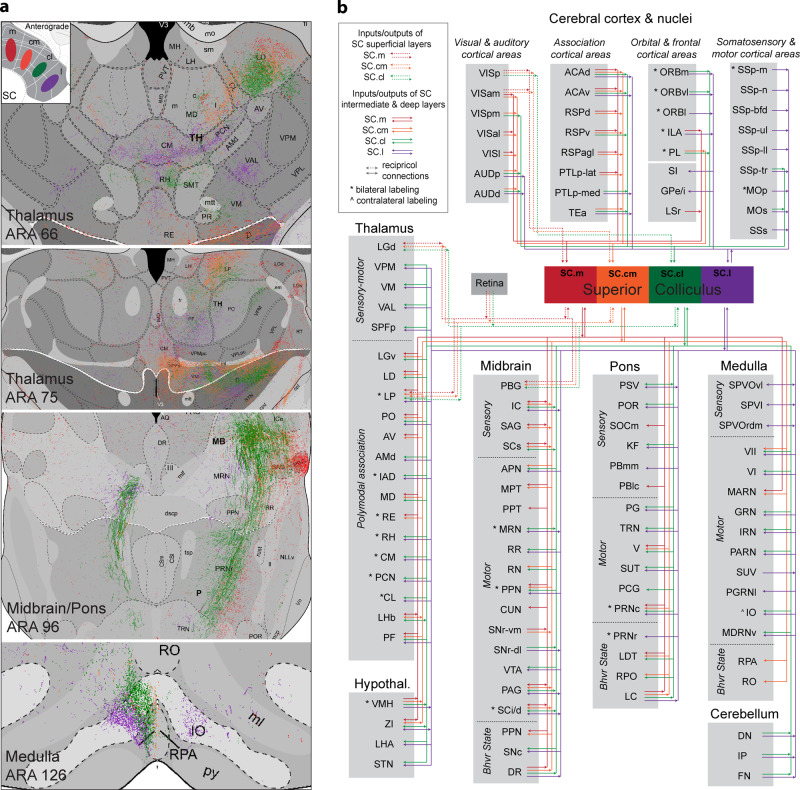
Fig. 4. Brain-wide connectivity of SC inputs and outputs.
a Color-coded map of anterograde projections from SC zones throughout the brain demonstrating topographic output patterns. Top left insert is a visual aid representation the anterograde injections placed in each SC zone, with colors corresponding to the same color of projections throughout the brain. See Supplementary Table 2 for injection site details. SC.m (red): SW190619-04A (PHAL), SW190619-02A (PHAL); SC.cm (orange): SW190619-02A (AAV-tdTomato); SC.cl (green): SW171010-01A (AAV-gfp), SW171010-02A (AAV-gfp); SC.l (purple): SW171010-01A (AAV-tdTomato), SW171010-01A (PHAL). b Unweighted wiring map of all inputs and outputs of superior colliculus zones and layers. Assembled using data from anterograde and retrograde injections placed in SC to systematically trace outputs and inputs distributed from cortex down through the hindbrain and cerebellar structures. Color-code associations: red (SC.m), orange (SC.cm), green (SC.cl), purple (SC.l). See Supplementary Table 1 for complete list of abbreviations.

