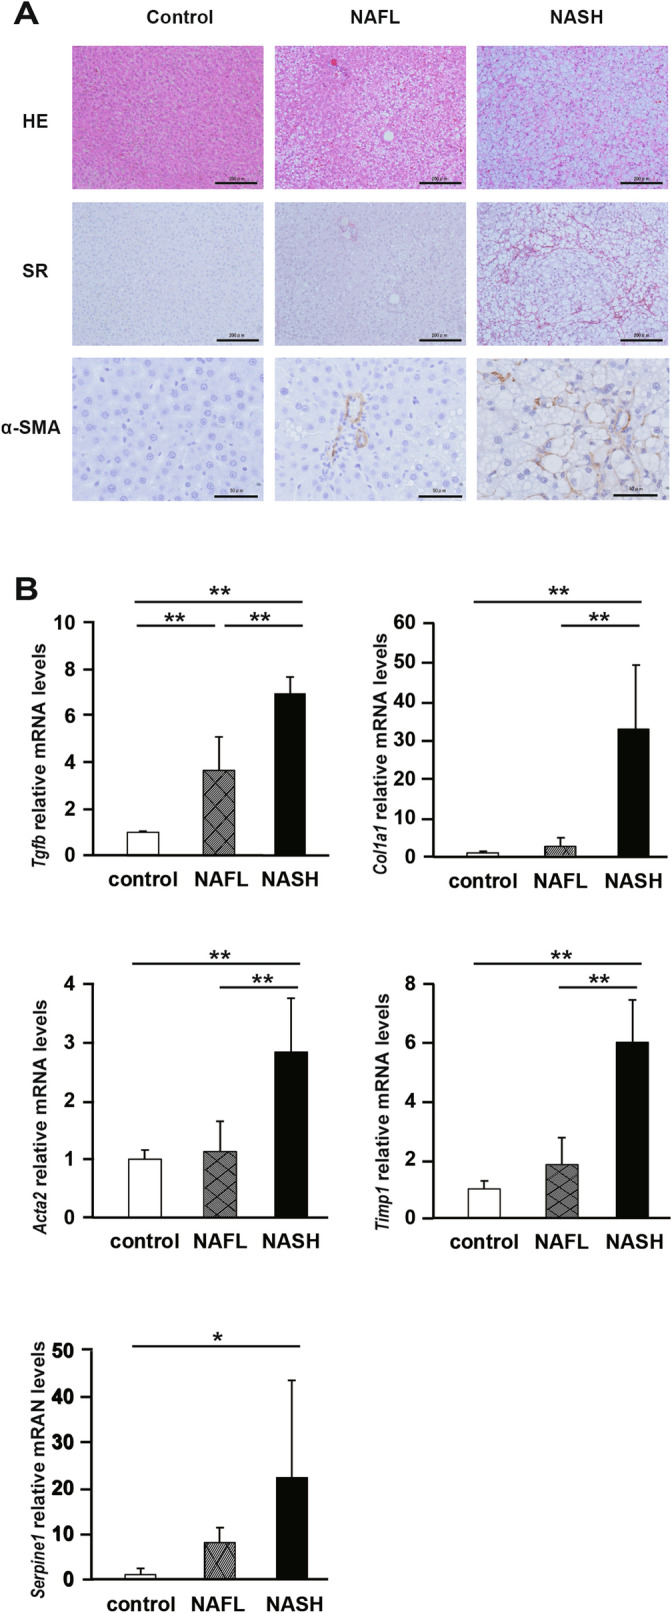
Figure 2.

Liver fibrosis and activationoh hepatic stellate cells (HSCs) in nonalcoholic steatohepatitis (NASH) rats. (A) Representative images of liver sections stained with hematoxylin and eosin (H&E), Sirius Red stain, and anti-α-SMA antibody. (B) The mRNA levels of liver fibrosis markers, transforming growth factor-β (Tgfb), collagen 1a1 (Col1a1), α-smooth muscle actin (Acta2), tissue inhibitor of metalloproteinase 1 (Timp1), and plasminogen activator inhibitor 1 (Serpine1). N = 5 per group. Statistical analysis among the three groups was performed using Kruskal–Wallis ANOVA. Only when a significant difference was found, Tukey's multiple comparison test was performed. *P < 0.05, **P < 0.01.
