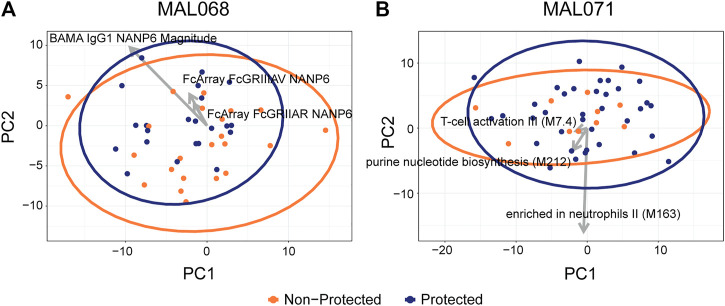
FIGURE 4.
Scatterplots of participant factor scores on the first (PC1) and second (PC2) principal components of a principal components analysis on (A) MAL068 data (ARR and RRR arms); (B) MAL071 data (RRR and RRr arms). Arrows show the factor loadings for the top three variables by CV-AUC for each dataset. A total of 220 features were used in the PCA analysis, 133 of which are RNA-seq BTMs.

