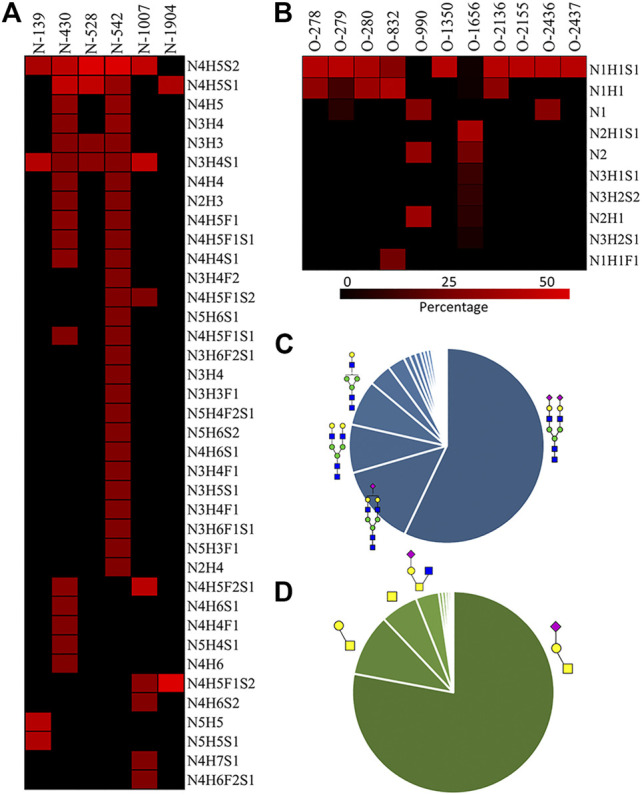
FIGURE 3.

A) N-glycan percentage of each N-glycosite; (B) O-glycan percentage of each O-glycosite; (C) overall N-glycan percentage; (D) overall O-glycan percentage.  : GlcNAc;
  : GalNAc;
  : Gal;
  : Neu5Ac;
  : Fuc.

A) N-glycan percentage of each N-glycosite; (B) O-glycan percentage of each O-glycosite; (C) overall N-glycan percentage; (D) overall O-glycan percentage.  : GlcNAc;
  : GalNAc;
  : Gal;
  : Neu5Ac;
  : Fuc.