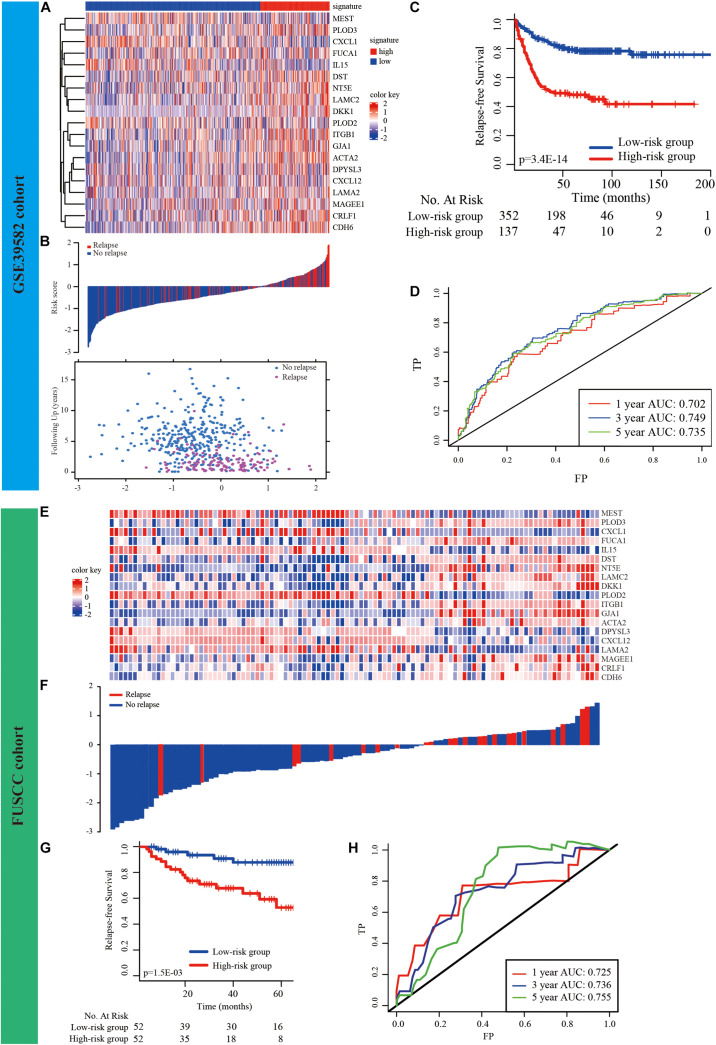
FIGURE 2.
Development and validation of prognostic EMT-related gene signature. (A) The expression of the EMT-related genes between low− and high-risk groups was shown in the heatmap. (B) Relationship between the survival status/risk score rank and survival time (years)/risk score rank. (C) K–M survival analysis of high− and low-risk groups. (D) Time-dependent ROC curve for RFS. The AUC was assessed at 1−, 3−, and 5-year. (E–H) Validation of the prognostic EMT-related gene signature in FUSCC cohort.

