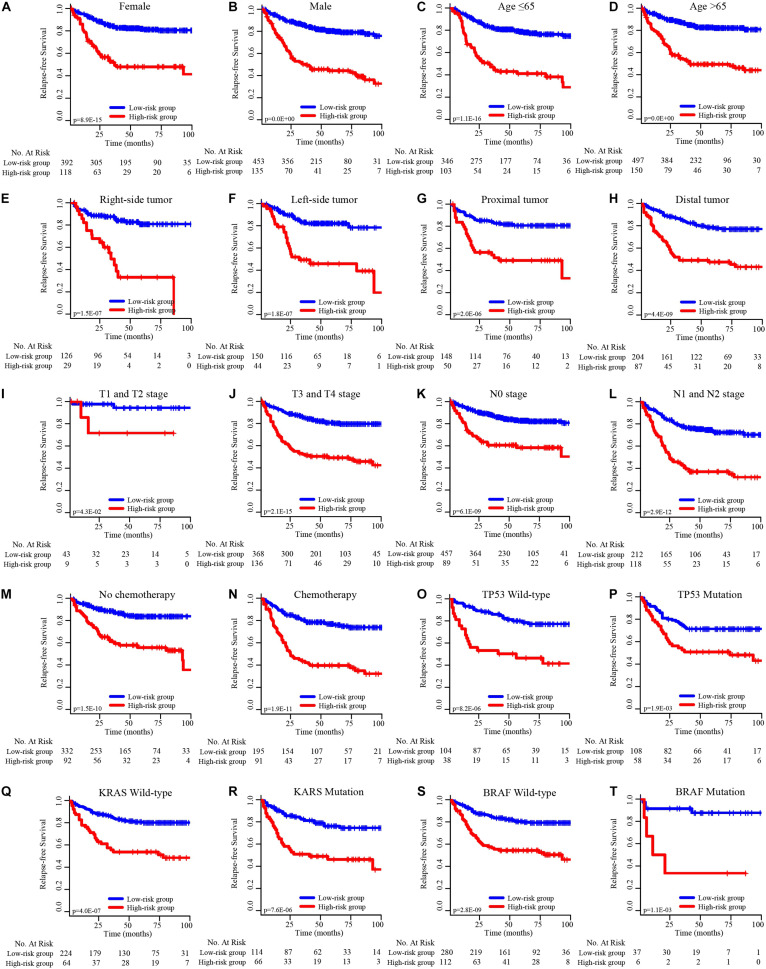
FIGURE 4.
K–M survival subgroup analysis of all CRC patients according to the EMT-related gene signature stratified by clinical characteristics. (A) Female, (B) male, (C) age ≤ 65 years, (D) age > 65 years, (E) right-side tumor, (F) left-side tumor, (G) proximal tumor, (H) distal tumor, (I) T1 and T2 stage, (J) T3 and T4 stage, (K) N0 stage, (L) N1 and N2 stage, (M) no chemotherapy, (N) chemotherapy, (O) TP53 wild-type, (P) TP53 mutation, (Q) KRAS wild-type, (R) KRAS mutation, (S) BRAF wild-type, (T) BRAF mutation.

