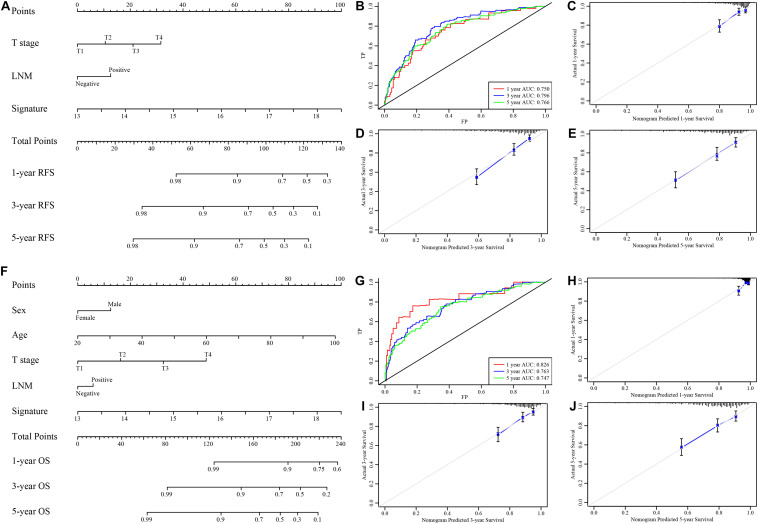
FIGURE 6.
Nomograms to predict 1−, 3−, and 5-year RFS and OS in the GSE39582 set. (A) Nomogram for predicting the 1−, 3−, and 5-year RFS time in CRC patients. (B) Time-dependent ROC curve for RFS. The AUC was assessed at 1−, 3−, and 5-year. (C–E) Calibration curve for the prediction of 1−, 3−, and 5-year RFS. (F) Nomogram for predicting the 1−, 3−, and 5-year OS time in CRC patients. (G) Time-dependent ROC curve for OS. The AUC was assessed at 1−, 3−, and 5-year. (H–J) Calibration curve for the prediction of 1−, 3−, and 5-year OS.

