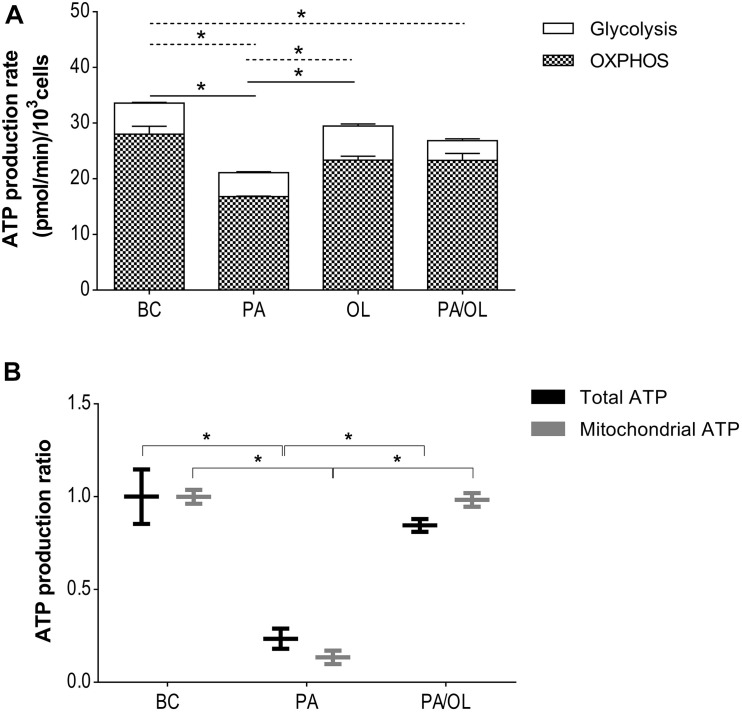
FIGURE 4.
Evaluation of energy balance. (A) Total ATP production rate estimated from the values of oxygen consumption (OCR) and the proton production rate (PPR). The production rate of total ATP in pmol/min and the distribution of the rate corresponding to the production by OXPHOS (stripes) and by the glycolytic pathway (white) is represented. Significant differences (p < 0.05) are represented by continuous line (OXPHOS) and discontinuous line (glycolytic pathway). (B) Measurement of ATP production by luminescence, including both total and mitochondrial ATP. All data were obtained from three independent experiments, expressed as mean ratio in relation to BC ± deviation standard. *p < 0.05. BC = basal condition; PA = palmitic acid; OL = oleic acid; OXPHOS = oxidative phosphorylation.

