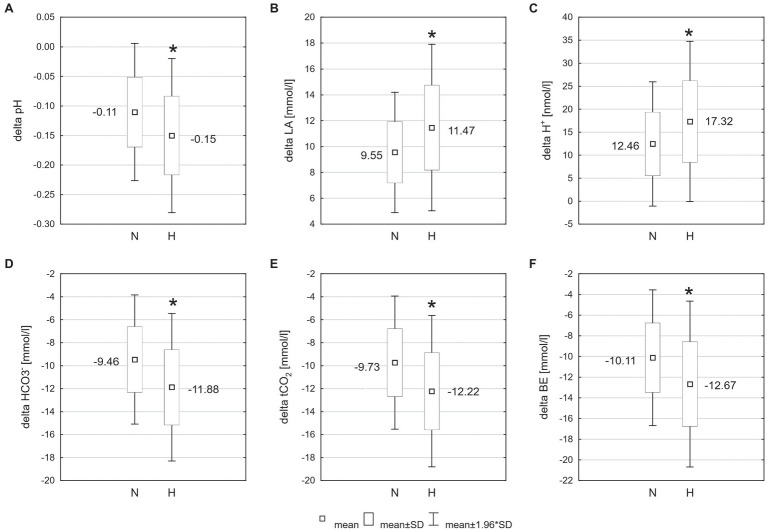
Figure 3.
Changes of acid–base balance following 30 km time trial in normoxia (N) and hypoxia (H). *p < 0.05 – significant differences between N and H; (A) delta pH – blood pH changes after exercise, (B) delta LA – change in blood lactate concentration, (C) delta H+ − change in hydrogen ion concentration, (D) − change in bicarbonate concentration, (E) tCO2 – change in total carbon dioxide concentration, and (F) BE – change in base excess.

