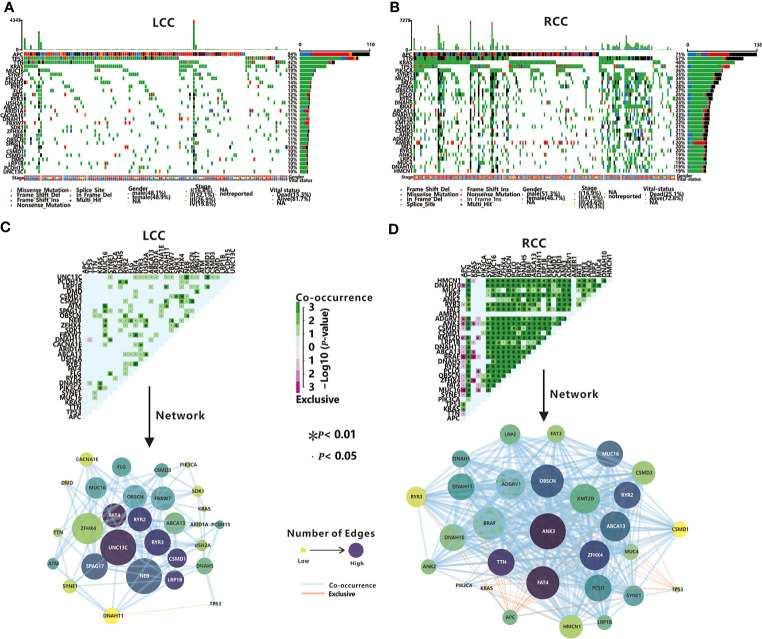
Figure 2.
TMGs in LCC and RCC. Waterfall plots show the mutation status (middle)and the mutation rate (right)of each TMG, and the mutation frequency (top), the gender, stage and vital status (bottom) of each patient in LCC (A) and RCC (B). Mutually exclusive and co-occurring gene pairs (top), and networks of mutational interaction (bottom) in LCC (C) and RCC (D).

