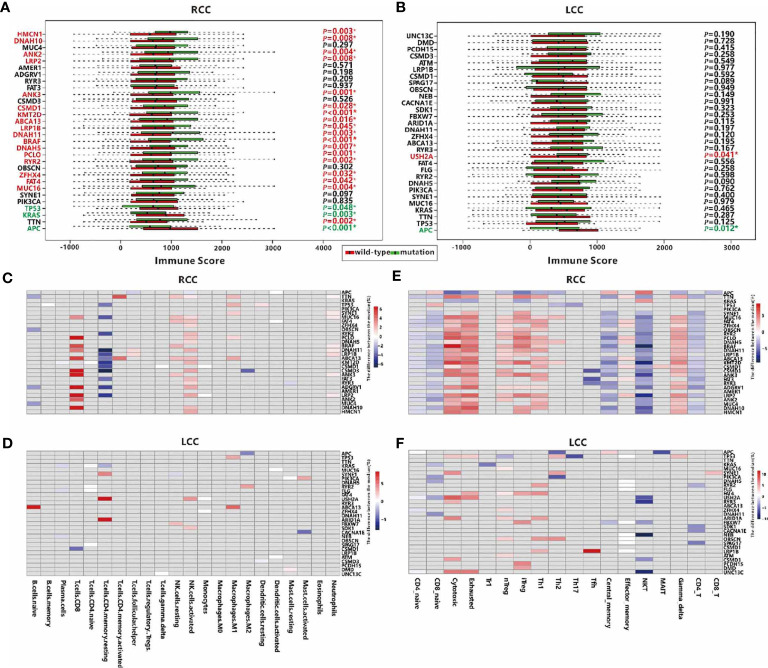
Figure 3.
Associations between TMGs and TIME in RCC and LCC. Associations between mutation of TMGs and the immune score in RCC (A) and LCC (B) respectively. TMGs marked in red are associated with a higher immune score when they are mutated while TMGs marked in green have the opposite effect. Associations between TMGs and 22 immune cells using the Wilcoxon test in RCC (C) and LCC (D). Associations between TMGs and 18 T cells using the Wilcoxon test in RCC (E) and LCC (F). The grey cells represent insignificant associations while the colored cells represent significant associations with p<0.05. The red color represents a higher immune cell fraction in mutation group while the blue color represents a lower immune cell fraction.

