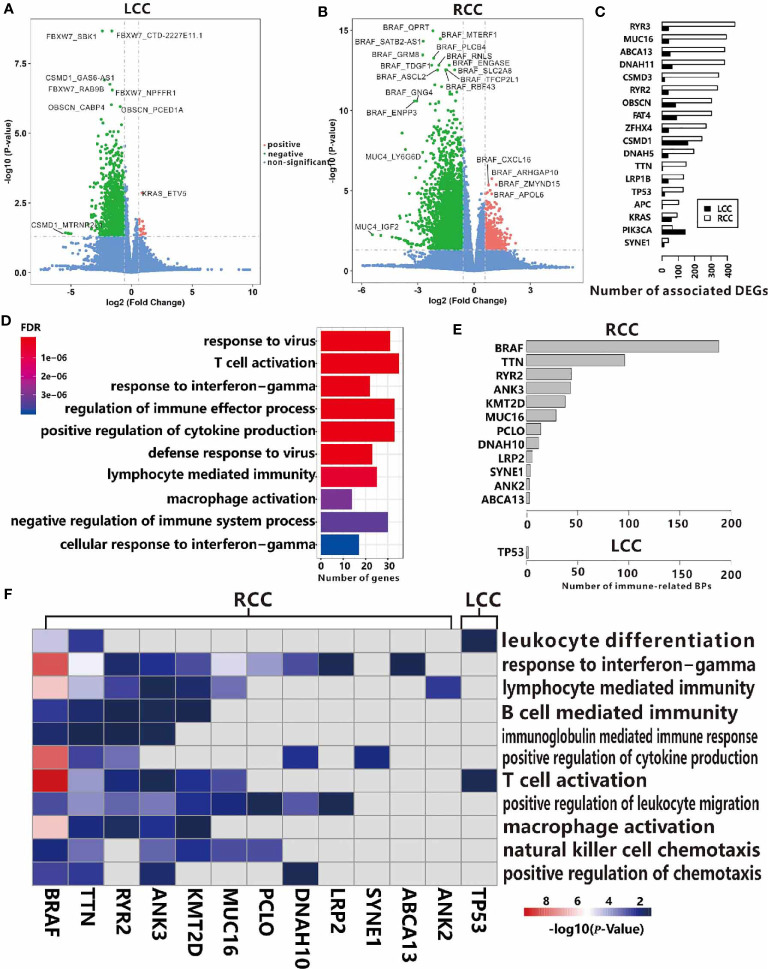
Figure 4.
Associations between TMGs and DEGs in RCC (A) and LCC (B). (C) The number of associated DEGs of the 18 common TMGs in RCC and LCC. (D) GO functional enrichment analysis of TMG-upregulating DEGs in RCC. (E) The number of immune-related BP in the up-regulated genes for each TMG in RCC and LCC. (F) The heatmap showing the -log10(P-values) of immune-related BP. The color strength represents the -log10(P-values) of associations, the grey cells represent insignificant associations in RCC and LCC.

