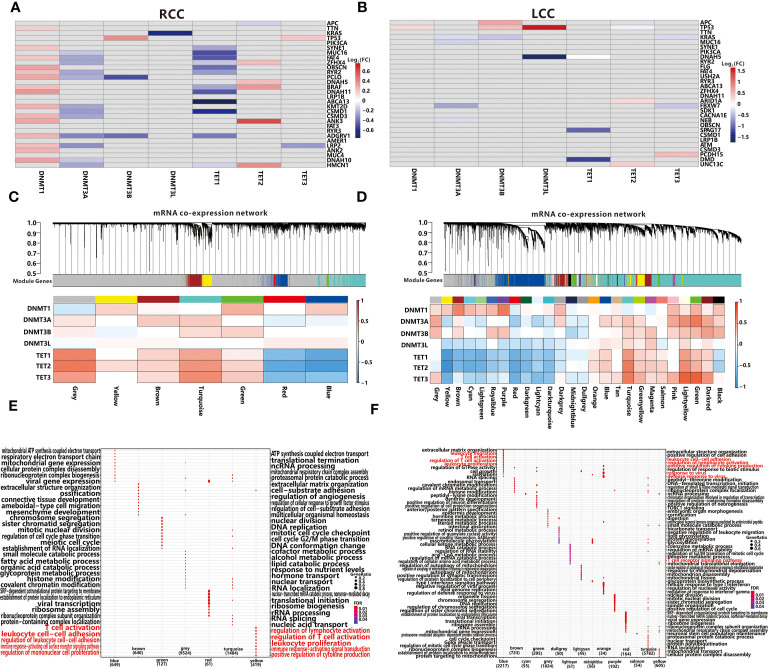
Figure 6.
Associations between TMGs and 7 methylation-associated genes using the Wilcoxon test in RCC (A) and LCC (B). The grey cells represent insignificant associations while the colored cells represent significant associations with p<0.05. The red color represents a higher expression in mutation group while the blue color represents a lower expression. WGCNA resolves co-expressed modules in RCC (C) and LCC (D). Top panels describe modules defined by dynamic tree cutting and the grey color represents genes not belonging to any modules. Bottom heatmaps represent associations between modules and 7 methylation-associated genes. Cells with black edge represent significant associations with p<0.05. GO functional enrichment analysis of each module in RCC (E) and LCC (F).

