Figure 7.
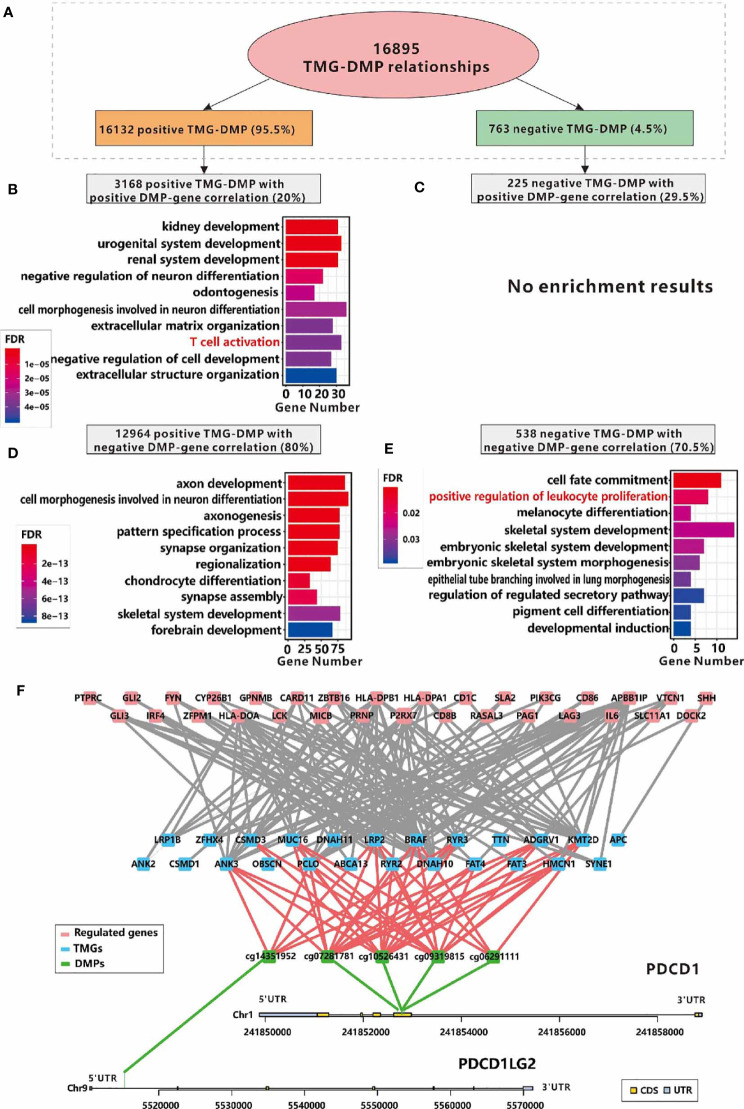
Relationships between immune infiltration and DMPs regulated by TMGs in RCC. (A) The number and the proportions of positive and negative TMG-DMP relationships. (B) The GO functional enrichment analysis of the genes which are positively correlated with the DNA methylation level of TMG-upregulating DMPs. (C) No significant result was found in the genes which are positively correlated with the DNA methylation level of TMG-downregulating DMPs. (D) The GO functional enrichment analysis of the genes which are negatively correlated with the DNA methylation level of TMG-upregulating DMPs. (E) The GO functional enrichment analysis of the genes which are negatively correlated with the DNA methylation level of TMG-downregulating DMPs. (F) The network among TMGs (blue), DNA methylation probes (green) and genes (red) whose functions are annotated with T cell activation, of these, DNA methylation probes are derived from PDCD1 and PDCD1LG2.

