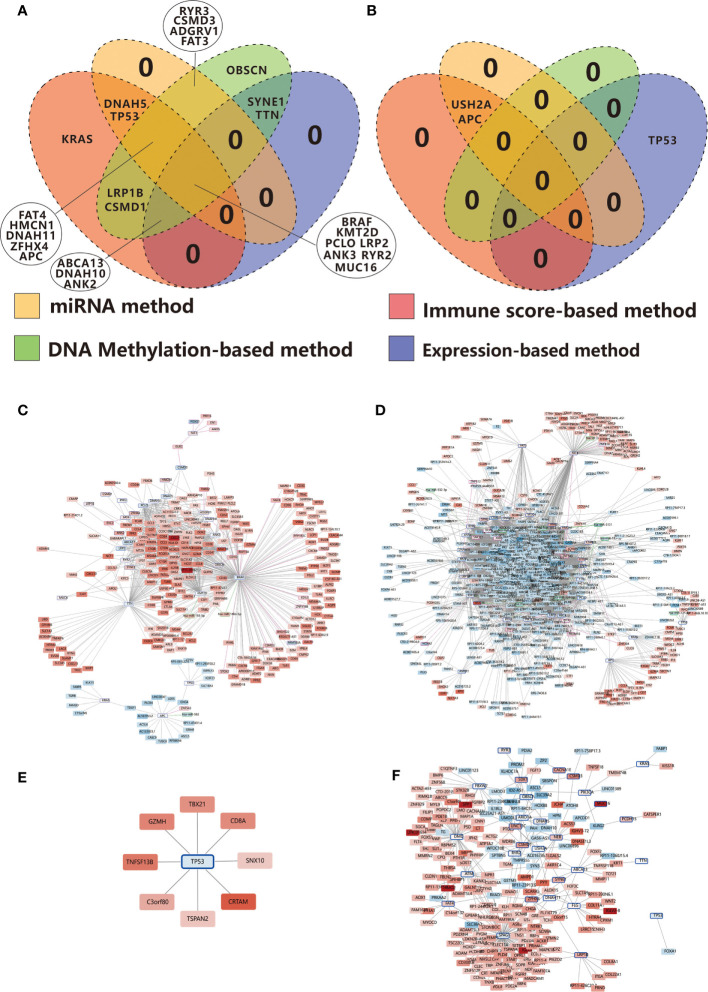
Figure 8.
Venn diagrams show the overlapping immune-related TMGs identified using the immune score-based method, gene expression-based method, miRNA target-based method, and DNA methylation-based method in RCC (A) and LCC (B). (C) Positive correlation network centered on immune-related TMGs in RCC. (D) Negative correlation network centered on immune-related TMGs in RCC. (E) Positive correlation network centered on immune-related TMGs in LCC. (F) Negative correlation network centered on immune-related TMGs in LCC. The color strength represents the fold change of expression in the high-immunity group compared to that in the low-immunity group. Red indicates up-regulation while blue suggests down-regulation in the high-immunity group. The nodes with a blue edge represent TMGs, the nodes with no edge represent DEGs, the nodes with a purple edge represent the genes regulated by TMG-regulating DMPs while those with green edges represent miRNAs.

