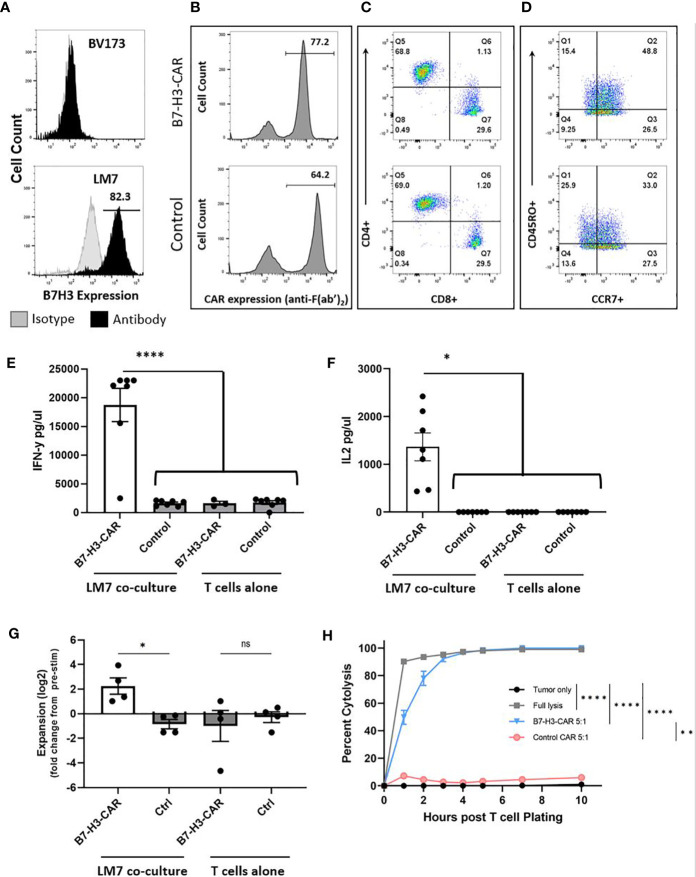
Figure 2.
LM7 OS B7-H3 expression, CAR T cell transduction, phenotype, and in vitro effector function. (A) The LM7 OS cell line was evaluated by flow cytometry for surface B7-H3 expression and shows robust expression. BV173 cells served as known negative controls. Activated T cells were transduced with lentiviral particles encoding B7-H3.CD28ζ CARs or a control CAR (B7-H3.CD8α.Δ). B-D) Representative flow plots of transduced T cells. (B) Percent transduction of B7-H3-CAR and control CAR T cells. (C) CAR T cell CD4+/CD8+ phenotype. (D) CAR T cell CD45RO+/CCR7+ memory phenotypes. E-F) CAR T cells were placed in coculture with LM7 tumor cells or plated alone at a 1:1 effector:target ratio. After 24 hours, supernatant was removed and assessed by ELISA for cytokine production. B7-H3-CAR T cells demonstrated robust (E) IFN-γ (p < 0.0001) and (F) IL-2 (p < 0.05) production. N = 7 donors; performed in duplicate. Statistical analysis by one-way ANOVA. (G) CAR T cells were placed in coculture with LM7 tumor cells or plated alone and fold change from baseline quantified as described in the text (N = 4 donors; performed in duplicate; p < 0.05; statistical analysis by one-way ANOVA). (H) Impedance-based cytotoxicity assay (xCELLigence) using LM7 cells as targets demonstrated robust cytotoxicity of B7-H3-CAR T cells compared to controls (N = 4 donors; E:T ratio = 5:1; statistical analysis by AUC and one-way ANOVA; *p < 0.05; **p < 0.01; ****p < 0.0001). ns, not significant.

