Fig. 1.
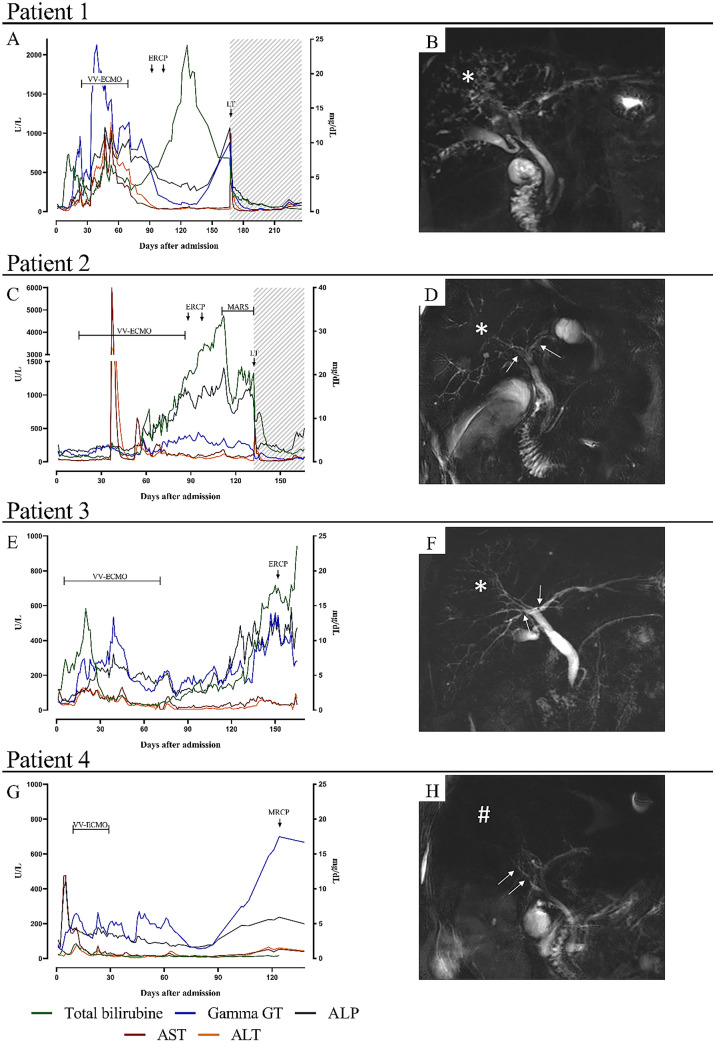
Temporal evolution of liver tests, treatments & MRCP images. For each individual patient (rows), the temporal evolution of liver enzymes, along with time points when critical diagnostic or treatment events occurred (left). Levels of gamma-glutamyltransferase (Gamma GT), alkaline phosphatase (ALP), aspartate transaminase (AST) and alanine transaminase (ALT) are projected on the left vertical axis and expressed as U/L, total bilirubin is projected on the right vertical axis and is expressed as mg/dl. VV-ECMO veno-venous extracorporeal membrane oxygenation, ERCP endoscopic retrograde cholangiopancreatography, MARS molecular absorbent recirculating system, LT liver transplantation. Cholestasis was defined as alkaline phosphatase > 1.5 times the upper limit. Also shown are a representative MRCP image for each patient (right) illustrating: in patient 1, diffuse beading of the intrahepatic biliary system (*); in patient 2 and 3, diffuse beading of the intrahepatic biliary ducts (*) and focal strictures on the left and right hepatic ducts (arrows); in patient 4, focal strictures on the right hepatic duct (arrows) and diminished arborisation of the intrahepatic biliary tree (#). All these findings are consistent with the diagnosis of ‘Secondary Sclerosing Cholangitis in Critically Ill Patients’ (SSC-CIP)

