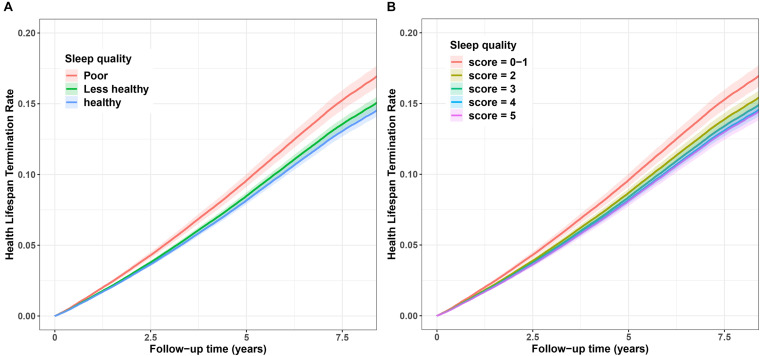
FIGURE 2.
Cumulative hazard curve for the associations between sleep quality and risk of terminated health span. (A) Sleep quality (poor, less–healthy, and healthy). (B) Sleep score (scores 0–1, 2, 3, 4, and 5). The Y-axis represents cumulative hazard of terminated health span, the while X-axis represents the follow-up time (years). Shaded regions represent the 95% confidence intervals (95% CIs). Cumulative hazard curves were based on the fully adjusted model.

