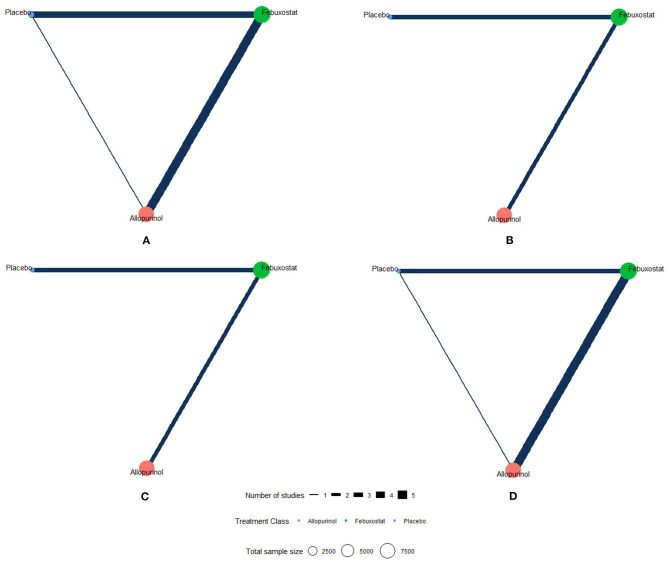
Figure 2.
Network plots of each outcome. The network of eligible studies for different outcomes. Different color of nodes represents different treatment. The node sizes correspond to the number of participants that investigated the treatments. The thickness of edges represents the number of trials. A lack of line indicates that there were no head-to-head trials between two treatments for this outcome. (A) MACE (major adverse cardiovascular events), (B) non-fatal MI (myocardial infarction), (C) non-fatal stroke, and (D) cardiovascular death.

