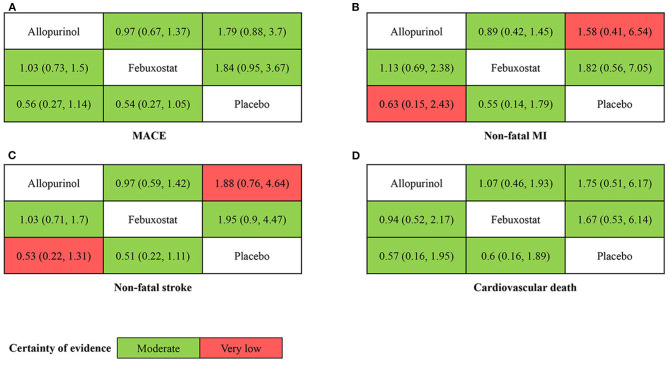
Figure 3.
League table of each outcome. Each number is an odds ratio (=column/row), and 95% confidence interval. Different color represents different certainty of evidence. OR < 1 favors the drug in the column. (A) MACE (major adverse cardiovascular events), (B) non-fatal MI (myocardial infarction), (C) non-fatal stroke, and (D) cardiovascular death.

