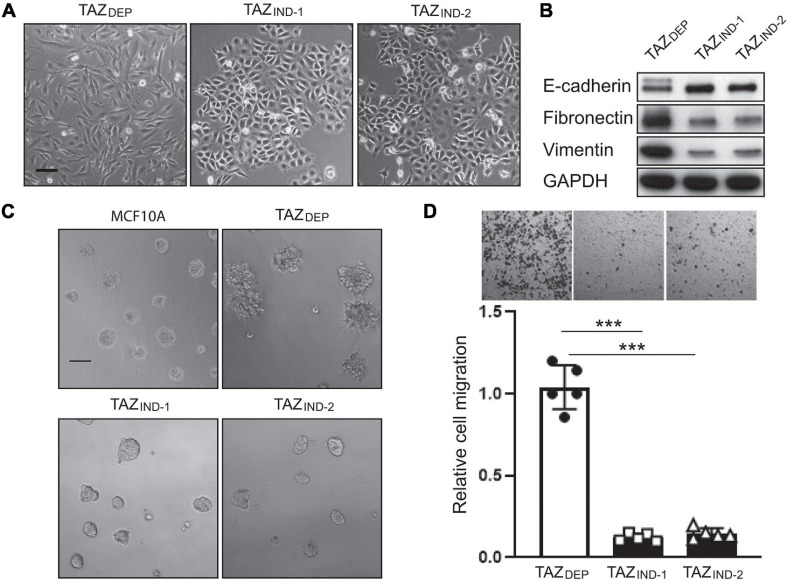
FIGURE 2.
TAZDEP cells undergo EMT. (A) Representative images of TAZDEP and TAZIND cell morphology in a 2D culture. TAZDEP cells grown in the presence of 2 μg/ml dox. Scale bar = 50 μm. (B) Immunoblotting detection of E-cadherin, fibronectin, and vimentin in TAZDEP and TAZIND cells. GAPDH was used as a loading control. (C) Representative images of MCF10A, TAZDEP, and TAZIND cells grown in a 3D culture. Scale bar = 100 μm. (D) Representative images and quantification of TAZDEP and TAZIND cell migration. Data are shown as the mean ± SD. Unpaired two-tailed Student’s t-test: ***p < 0.001.

