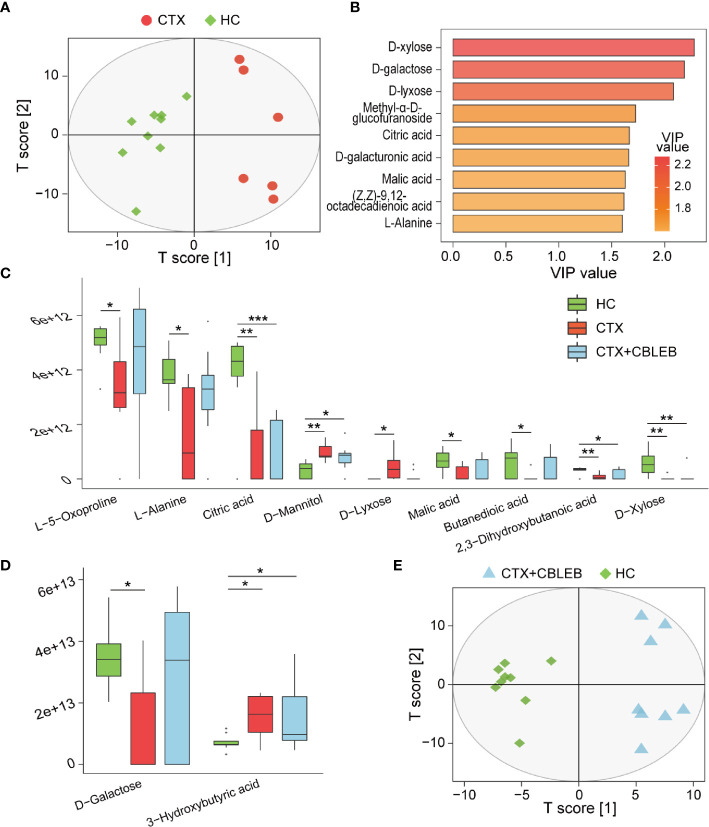
Figure 4.
CBLEB alleviates cyclophosphamide-induced serum metabolism disorders. (A) OPLS-DA plot illustrating clear separation of serum metabolic profiles of the CTX (n = 6) and HC (n = 9) groups. (B) VIP values of nine metabolites with the highest contribution to the differences between the CTX and HC groups. (C) Metabolites depleted after cyclophosphamide treatment and changes in their levels after CBLEB treatment. (D) Metabolites enriched after cyclophosphamide treatment and changes in their levels after CBLEB treatment. (E) OPLS-DA plot illustrating clear separation of serum metabolic profiles of the CTX+CBLEB (n = 8) and HC groups (n = 9). (*P < 0.05; **P < 0.01; ***P < 0.001).

