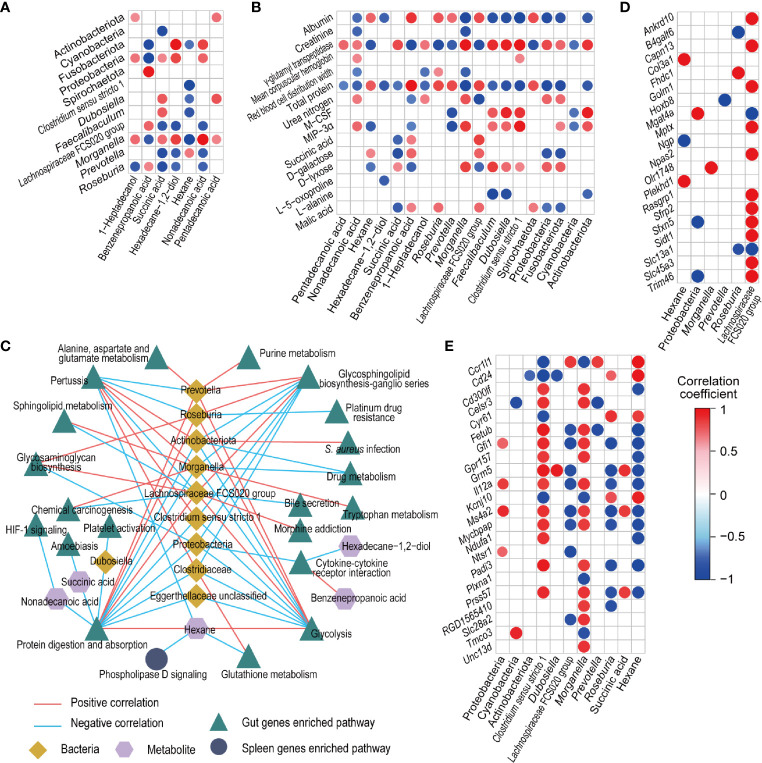
Figure 6.
Associations between fecal bacteria, fecal and serum metabolites, and gut and spleen genes influenced by CBLEB. (A) Correlation of CBLEB-influenced fecal bacteria with fecal metabolites. (B) Correlation of CBLEB-influenced fecal bacteria and metabolites with blood cytokines, metabolites, and indicators of the liver and kidney functions. (C) Pathways identified based on the genes that were positively or negatively correlated with individual bacteria or metabolites according to the KEGG database analysis (P < 0.01). The correlation coefficients for individual bacteria or metabolites within the corresponding pathway are presented as the mean correlation coefficient of all genes in the pathway positively or negatively correlated with individual bacteria or metabolites. (D) Correlation of CBLEB-influenced fecal bacteria and metabolites with the gut genes (P adj < 0.01). (E) Correlation of CBLEB-influenced fecal bacteria and metabolites with the spleen genes (P adj < 0.05).

