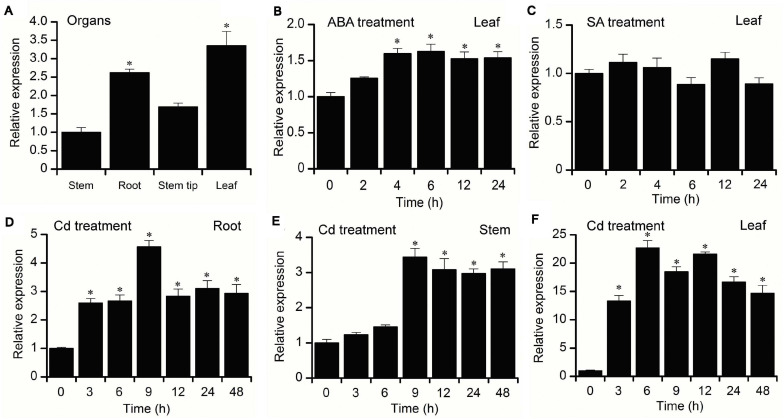
FIGURE 3.
Expression pattern of BnPCS1. (A) qRT-PCR analysis of BnPCS1 mRNA levels in the roots, stems, stem tips, and leaves of 21-day-old B. nivea seedlings. (B,C) BnPCS1 expression levels in the leaves of B. nivea seedlings treated with 100 μM ABA (B) or 1 mM SA (C) for 0, 2, 4, 6, 12, and 24 h. (D–F): BnPCS1 expression levels in the roots (D),stems (E), and leaves (F) of B. nivea seedlings treated with 200 μM Cd for 0, 3, 6, 9, 12, 24, and 48 h. Data are presented as the means of three biological replicates with SE shown by vertical bars. Asterisks indicate significant differences (p < 0.05) between the treatment groups and the controls.

