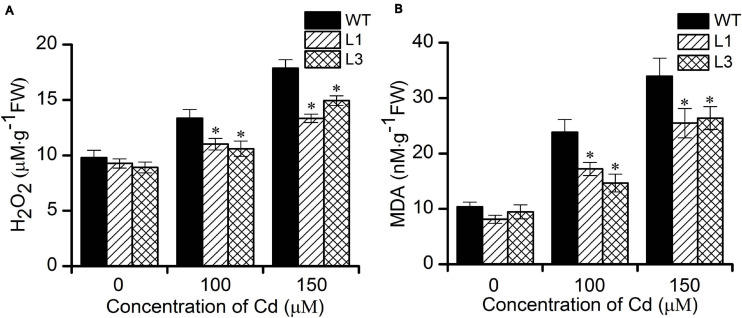
FIGURE 5.
Cellular H2O2 and MDA contents in WT and BnPCS1-expressing transgenic Arabidopsis plantsin response to Cd stress. (A) H2O2 contents in WT and transgenic line plants treated with 0, 100,and 150 μM Cd for 2 days. (B) MDA contents in WT and transgenic line plants treated with 0, 100,and 150 μM Cd for 14 days. Data are presented as the means of three biological replicates with SE shown by vertical bars. Asterisks indicate significant differences (p < 0.05) in Cd-treated plants compared to WT.

