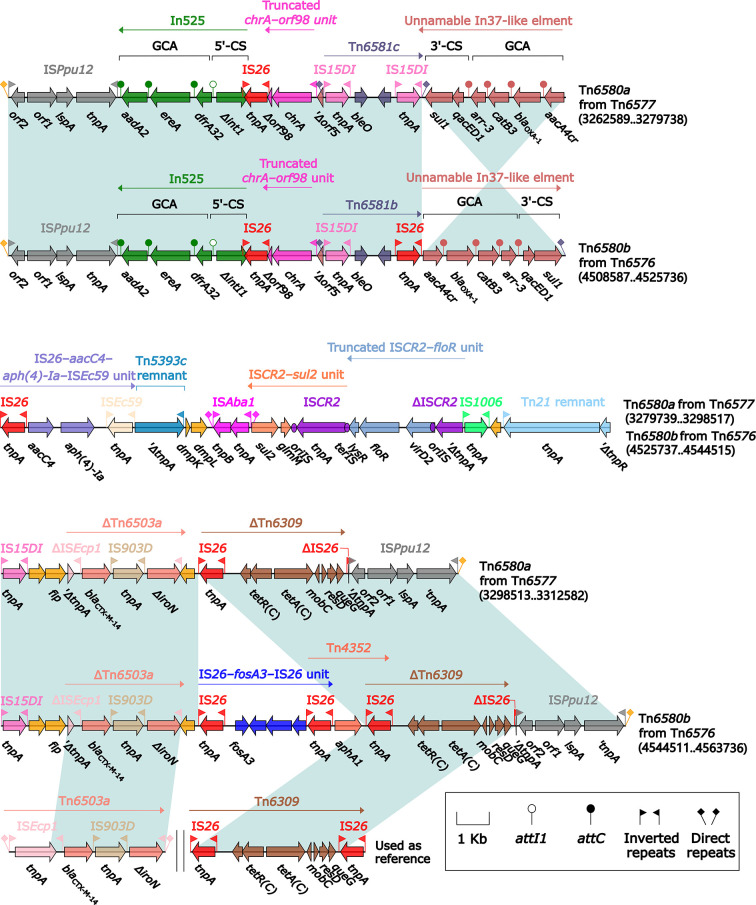
Figure 7.
Comparison of Tn6580a from Tn6577 and Tn6580b from Tn6576, and related regions. Genes are denoted by arrows. Genes, mobile elements, and other features are colored based on their functional classification. Shading denotes regions of homology (nucleotide identity ≥95%). Numbers in brackets indicate nucleotide positions within the chromosomes of strains 1701092 and QD23. The accession numbers of Tn6503a (Feng et al., 2015) and Tn6309 (Sun et al., 2016) used as reference are KP987215 and KX710094, respectively.

