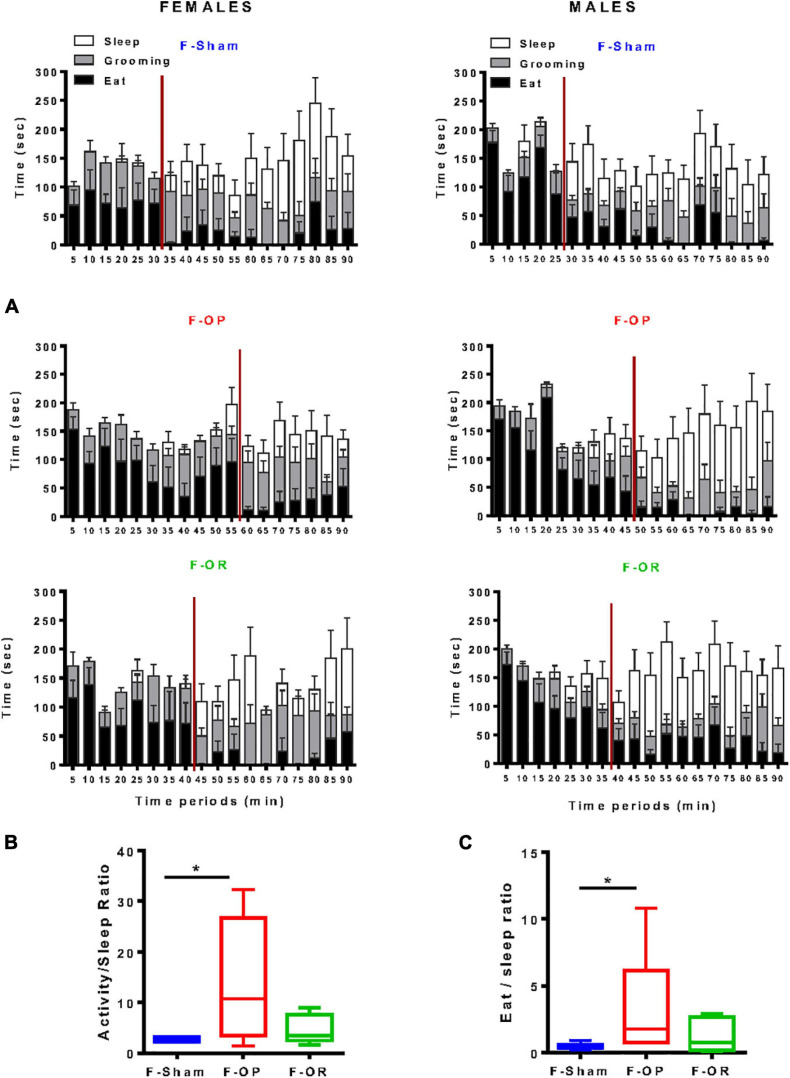
FIGURE 10.
Behavioral satiety sequence. (A) Blundell representations of behavioral satiety sequences for the three groups of females (left, n = 7–9) and males (right, n = 8–11), data are means ± SEM, satiety point is represented by the red vertical line and correspond to latency before behavioral switch between eat and sleep. (B) Activity-to-sleep ratio and (C) eat-to-sleep ratio in females (n = 7–9); data are medians and min–max values, *p < 0.05 indicates difference between groups, Kruskal–Wallis and post hoc Dunn’s test. Animals were 130-day old and fed HED.

