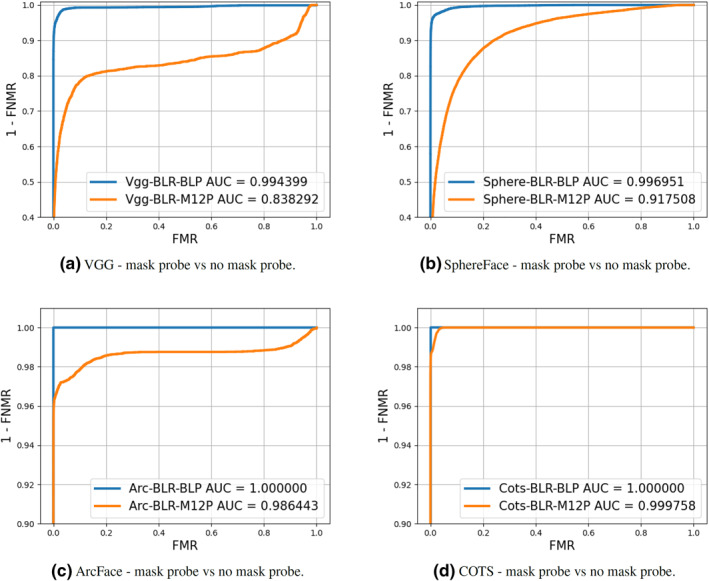
FIGURE 3.

The verification performance of the four investigated systems—VGGFace (a), SphereFace (b), ArcFace (c), and COTS (d)—is presented in the form of receiver operating characteristic (ROC) curves. For each system, two curves are plotted to represent the settings that include ‘masked’ face probes (BLR‐M12P) and the unmasked baseline (BLR‐BLP). The area under curve (AUC) is also listed for each ROC curve. As in Tables 2, 3, 4, 5, the negative effect of masked probes is apparent in the performance of the VGGFace ArcFace, SphereFace, and COTS models
