
Fig 2.
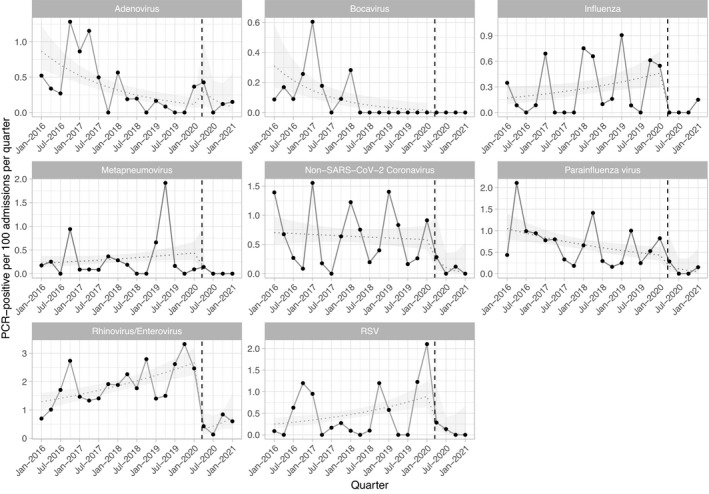
Quarterly incidence of respiratory virus infection in haematology inpatients. For each virus the dashed line indicates the modelled incidence, and the ribbon the 95% confidence interval, allowing for a linear trend before and after the onset of UK national social distancing restrictions, and a step change at this point (shown with a vertical dashed red line). PCR, polymerase chain reaction.