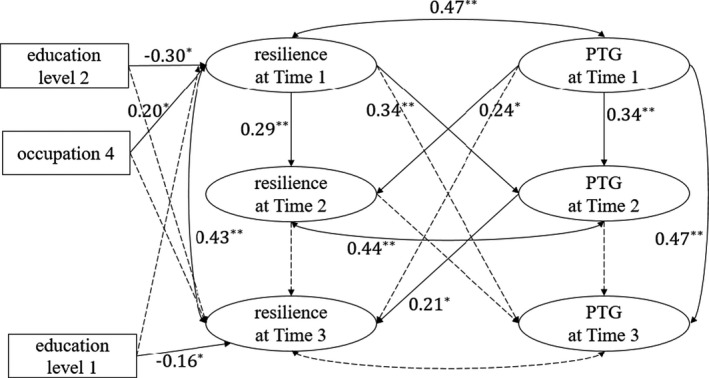
FIGURE 1.

Cross‐lagged model testing the relationship between resilience and PTG. Note. Path coefficients are standardised. Education level 1, education level 2, and occupation 1 were dummy variables. Among the three educational levels, using “junior college or below” as the benchmark, two dummy variables were generated: “education level 1” (college) and “education level 2” (“master's degree or above”). Among the five occupation categories, using “doctor” as the benchmark, four dummy variables were generated: “occupation 1” (nurse), “occupation 2” (medical technician), “occupation 3” (medical researcher), and “occupation 4” (administrator). * p < .05, **p < .01
